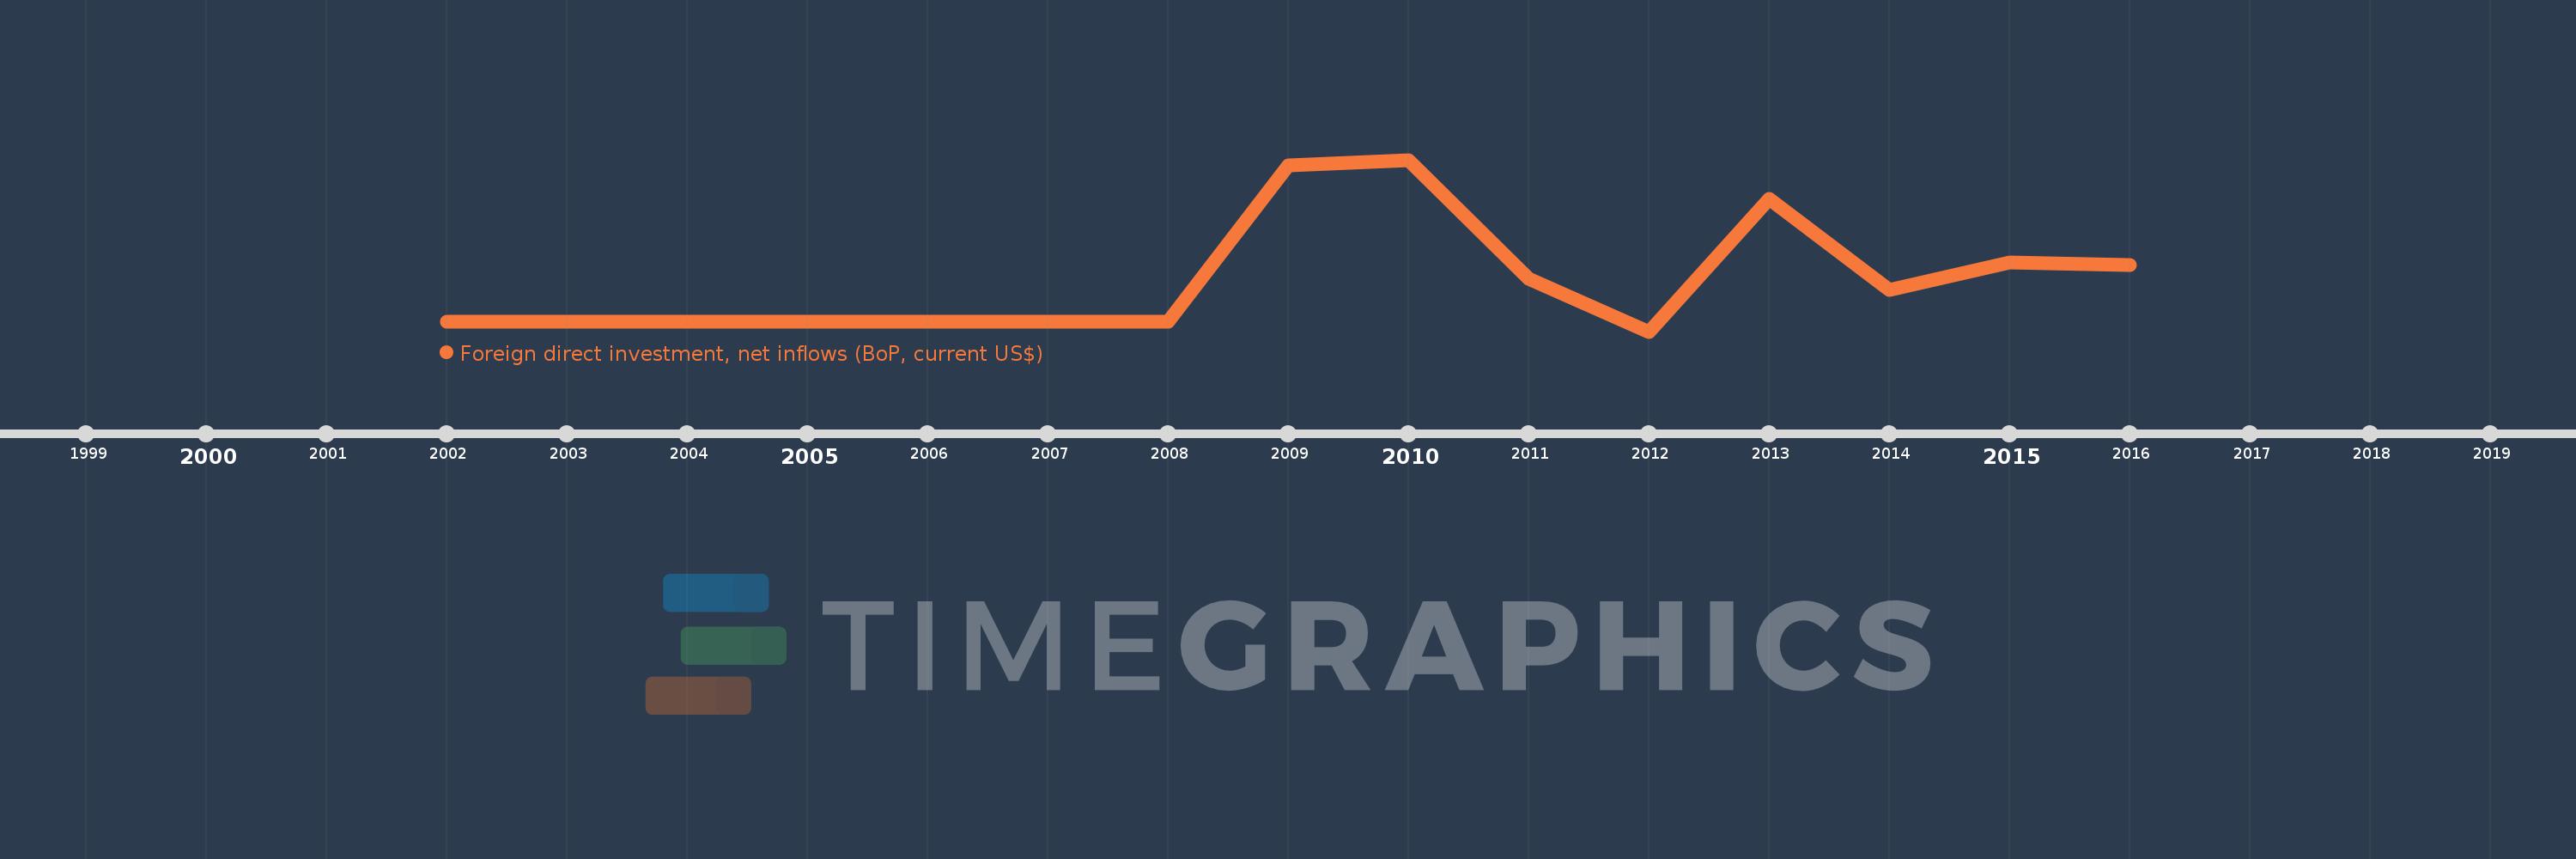
This timeline shows a graph from 2002 to 2016 of Tuvalu. No data until 2001. Number of actual observations by date: 15.
Source name:
World Development Indicators
Source organization:
International Monetary Fund, Balance of Payments database, supplemented by data from the United Nations Conference on Trade and Development and official national sources.
Categories, topics:
Economy & Growth, Financial Sector, External Debt
Last updated:
apr 23, 2017
Indicators value changes by year
Meaning:
439.604K
Minimum:
-119.088K
jan 1, 2012
Maximum:
1.751 mln
jan 1, 2010
At the date of observation
Value
Absolute change
Change from the previous value
jan 1, 2002
-9.31K
-9.31K
0.0%
jan 1, 2003
-9.78K
-469.8
5.05%
jan 1, 2004
-10.973K
-1.194K
12.21%
jan 1, 2005
-11.697K
-723.461
6.59%
jan 1, 2006
-11.417K
+279.64
-2.39%
jan 1, 2007
-10.583K
+834.542
-7.31%
jan 1, 2008
-11.054K
-471.298
4.45%
jan 1, 2009
1.688 mln
+1.699 mln
-15.37K%
jan 1, 2010
1.751 mln
+63.275K
3.75%
jan 1, 2011
455.234K
-1.296 mln
-74.0%
jan 1, 2012
-119.088K
-574.321K
-126.16%
jan 1, 2013
1.325 mln
+1.444 mln
-1.21K%
jan 1, 2014
336.812K
-988.231K
-74.58%
jan 1, 2015
630.994K
+294.183K
87.34%
jan 1, 2016
601.011K
-29.983K
-4.75%
Ranking of countries by current statistics by years