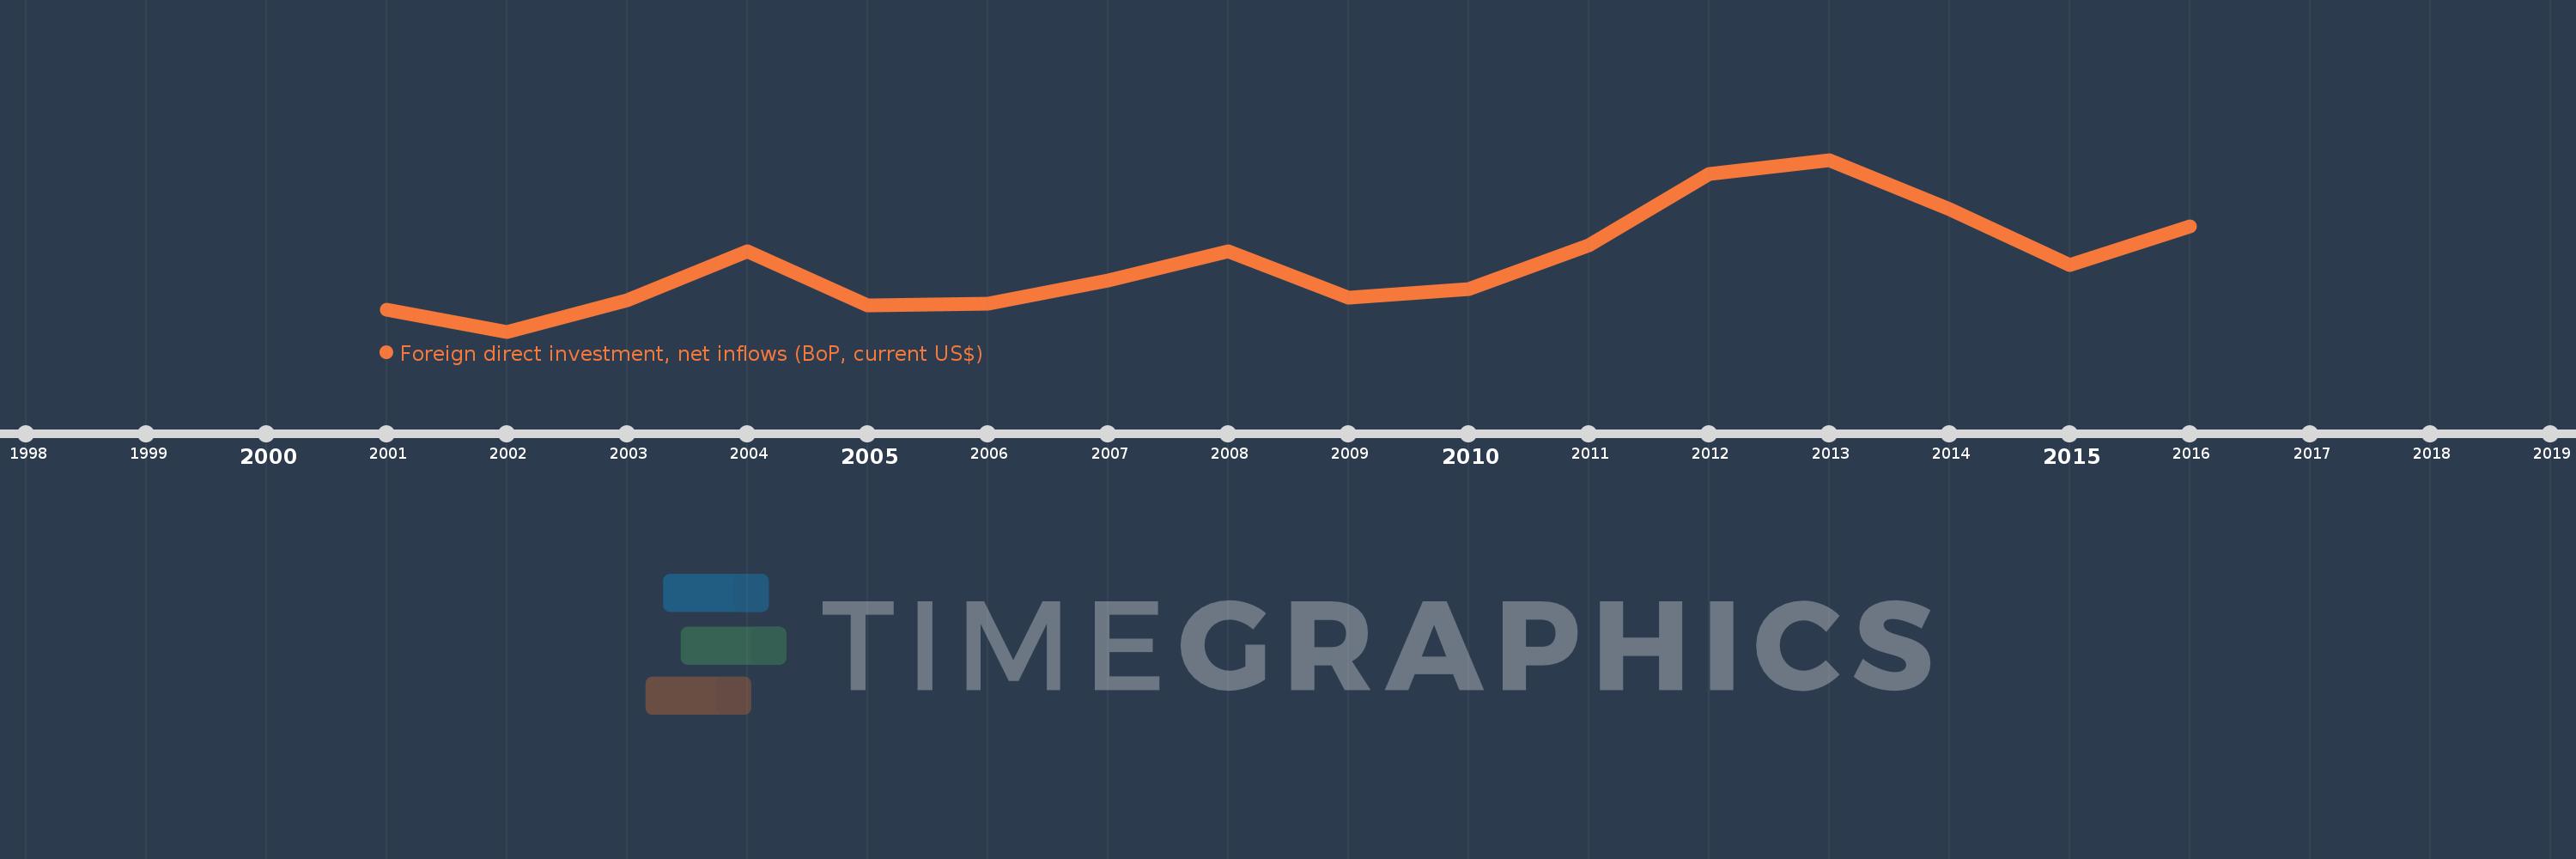
This timeline shows a graph from 2001 to 2016 of French Polynesia. No data until 2000. Number of actual observations by date: 16.
Source name:
World Development Indicators
Source organization:
International Monetary Fund, Balance of Payments database, supplemented by data from the United Nations Conference on Trade and Development and official national sources.
Categories, topics:
Economy & Growth, Financial Sector, External Debt
Last updated:
apr 23, 2017
Indicators value changes by year
Meaning:
47.714 mln
Minimum:
-19.17 mln
jan 1, 2002
Maximum:
147.2 mln
jan 1, 2013
At the date of observation
Value
Absolute change
Change from the previous value
jan 1, 2001
2.0 mln
+2.0 mln
0.0%
jan 1, 2002
-19.17 mln
-21.17 mln
-1.06K%
jan 1, 2003
10.931 mln
+30.101 mln
-157.02%
jan 1, 2004
58.213 mln
+47.282 mln
432.55%
jan 1, 2005
6.42 mln
-51.793 mln
-88.97%
jan 1, 2006
7.819 mln
+1.399 mln
21.79%
jan 1, 2007
30.65 mln
+22.831 mln
291.99%
jan 1, 2008
58.249 mln
+27.6 mln
90.05%
jan 1, 2009
13.884 mln
-44.365 mln
-76.16%
jan 1, 2010
21.844 mln
+7.96 mln
57.33%
jan 1, 2011
64.304 mln
+42.46 mln
194.38%
jan 1, 2012
133.84 mln
+69.536 mln
108.14%
jan 1, 2013
147.2 mln
+13.36 mln
9.98%
jan 1, 2014
99.207 mln
-47.992 mln
-32.6%
jan 1, 2015
45.315 mln
-53.892 mln
-54.32%
jan 1, 2016
82.719 mln
+37.404 mln
82.54%
Ranking of countries by current statistics by years