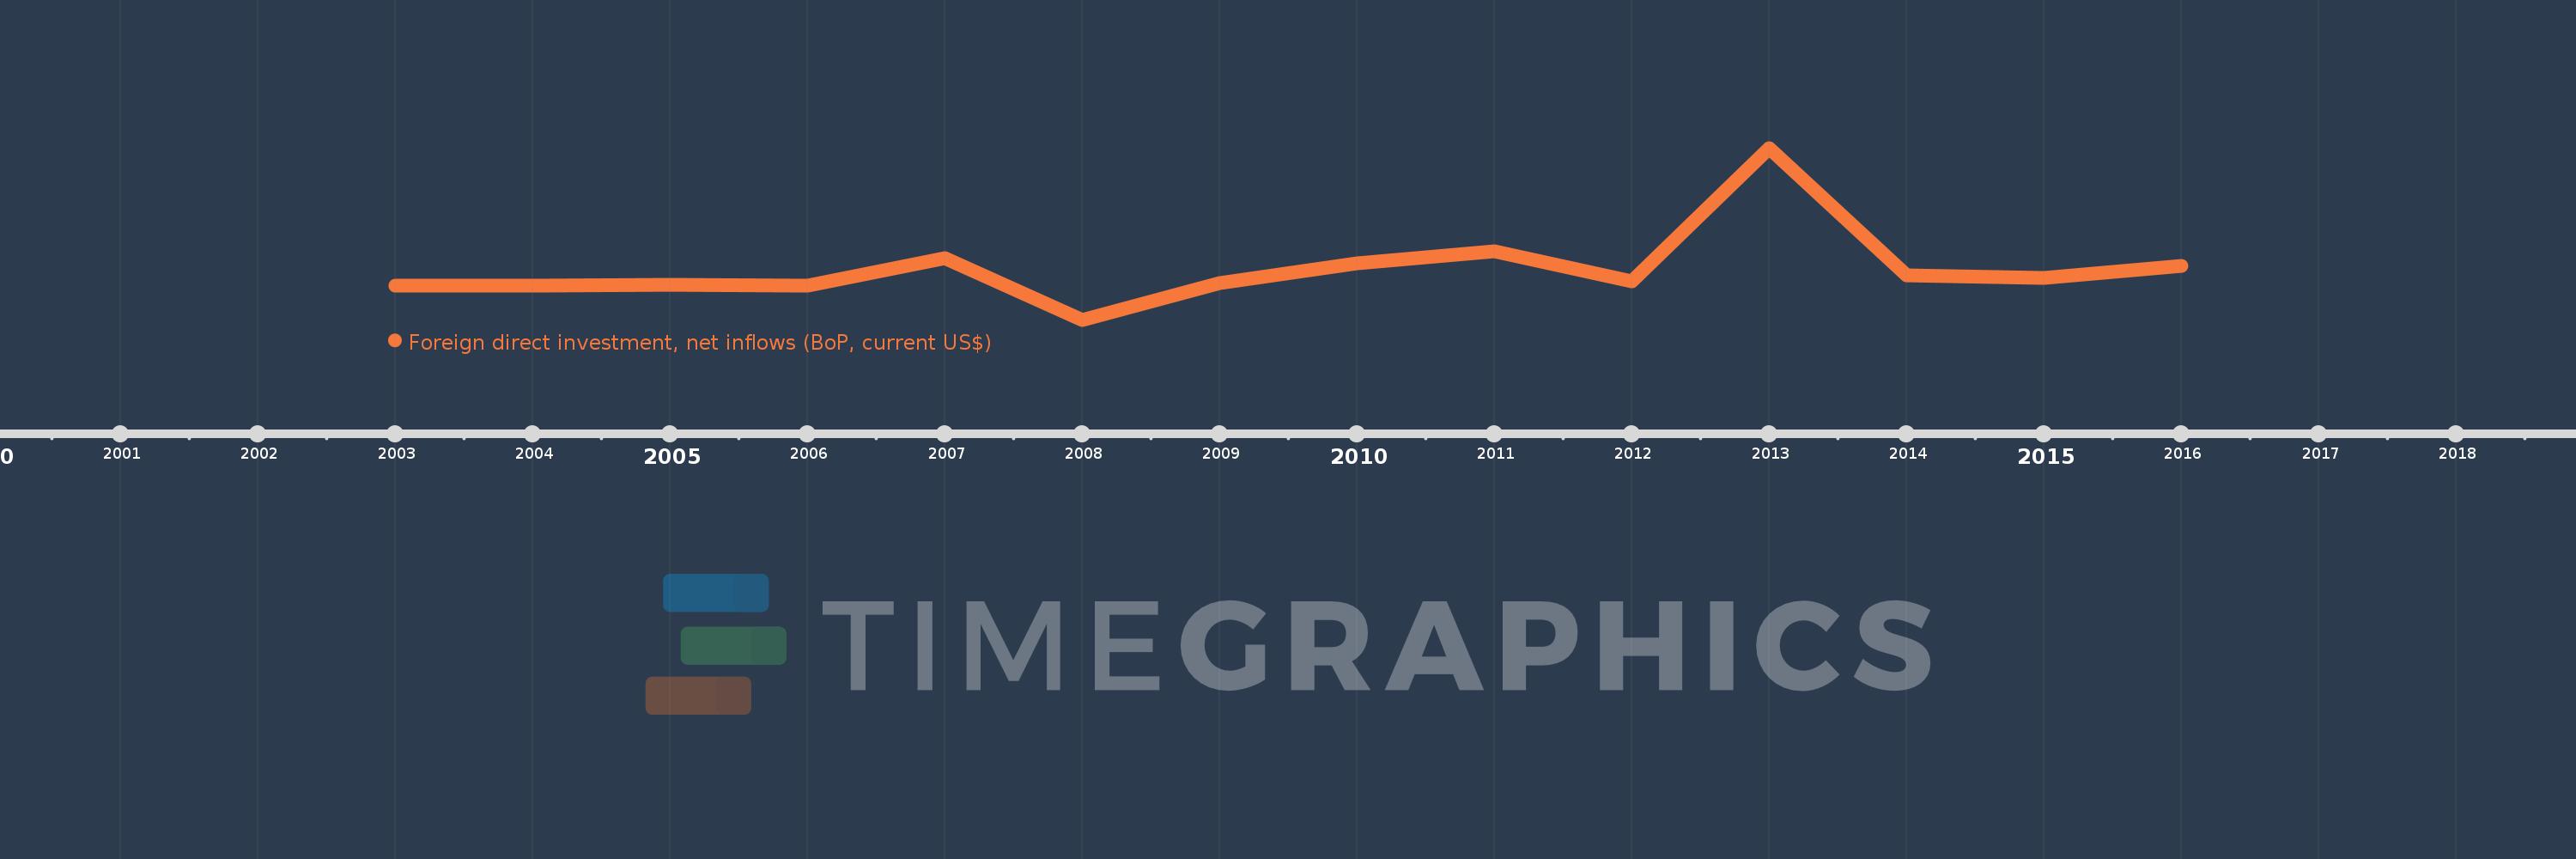
This timeline shows a graph from 2003 to 2016 of Luxembourg. No data until 2002. Number of actual observations by date: 14.
Source name:
World Development Indicators
Source organization:
International Monetary Fund, Balance of Payments database, supplemented by data from the United Nations Conference on Trade and Development and official national sources.
Categories, topics:
Economy & Growth, Financial Sector, External Debt
Last updated:
apr 23, 2017
Indicators value changes by year
Meaning:
21.306 bln
Minimum:
-29.679 bln
jan 1, 2008
Maximum:
143.003 bln
jan 1, 2013
At the date of observation
Value
Absolute change
Change from the previous value
jan 1, 2003
4.243 bln
+4.243 bln
0.0%
jan 1, 2004
4.291 bln
+47.931 mln
1.13%
jan 1, 2005
5.18 bln
+888.538 mln
20.71%
jan 1, 2006
4.645 bln
-534.874 mln
-10.33%
jan 1, 2007
32.22 bln
+27.575 bln
593.67%
jan 1, 2008
-29.679 bln
-61.899 bln
-192.12%
jan 1, 2009
7.117 bln
+36.797 bln
-123.98%
jan 1, 2010
27.255 bln
+20.138 bln
282.95%
jan 1, 2011
39.129 bln
+11.873 bln
43.56%
jan 1, 2012
8.843 bln
-30.285 bln
-77.4%
jan 1, 2013
143.003 bln
+134.16 bln
1.52K%
jan 1, 2014
15.371 bln
-127.632 bln
-89.25%
jan 1, 2015
12.073 bln
-3.298 bln
-21.46%
jan 1, 2016
24.596 bln
+12.523 bln
103.72%
Ranking of countries by current statistics by years