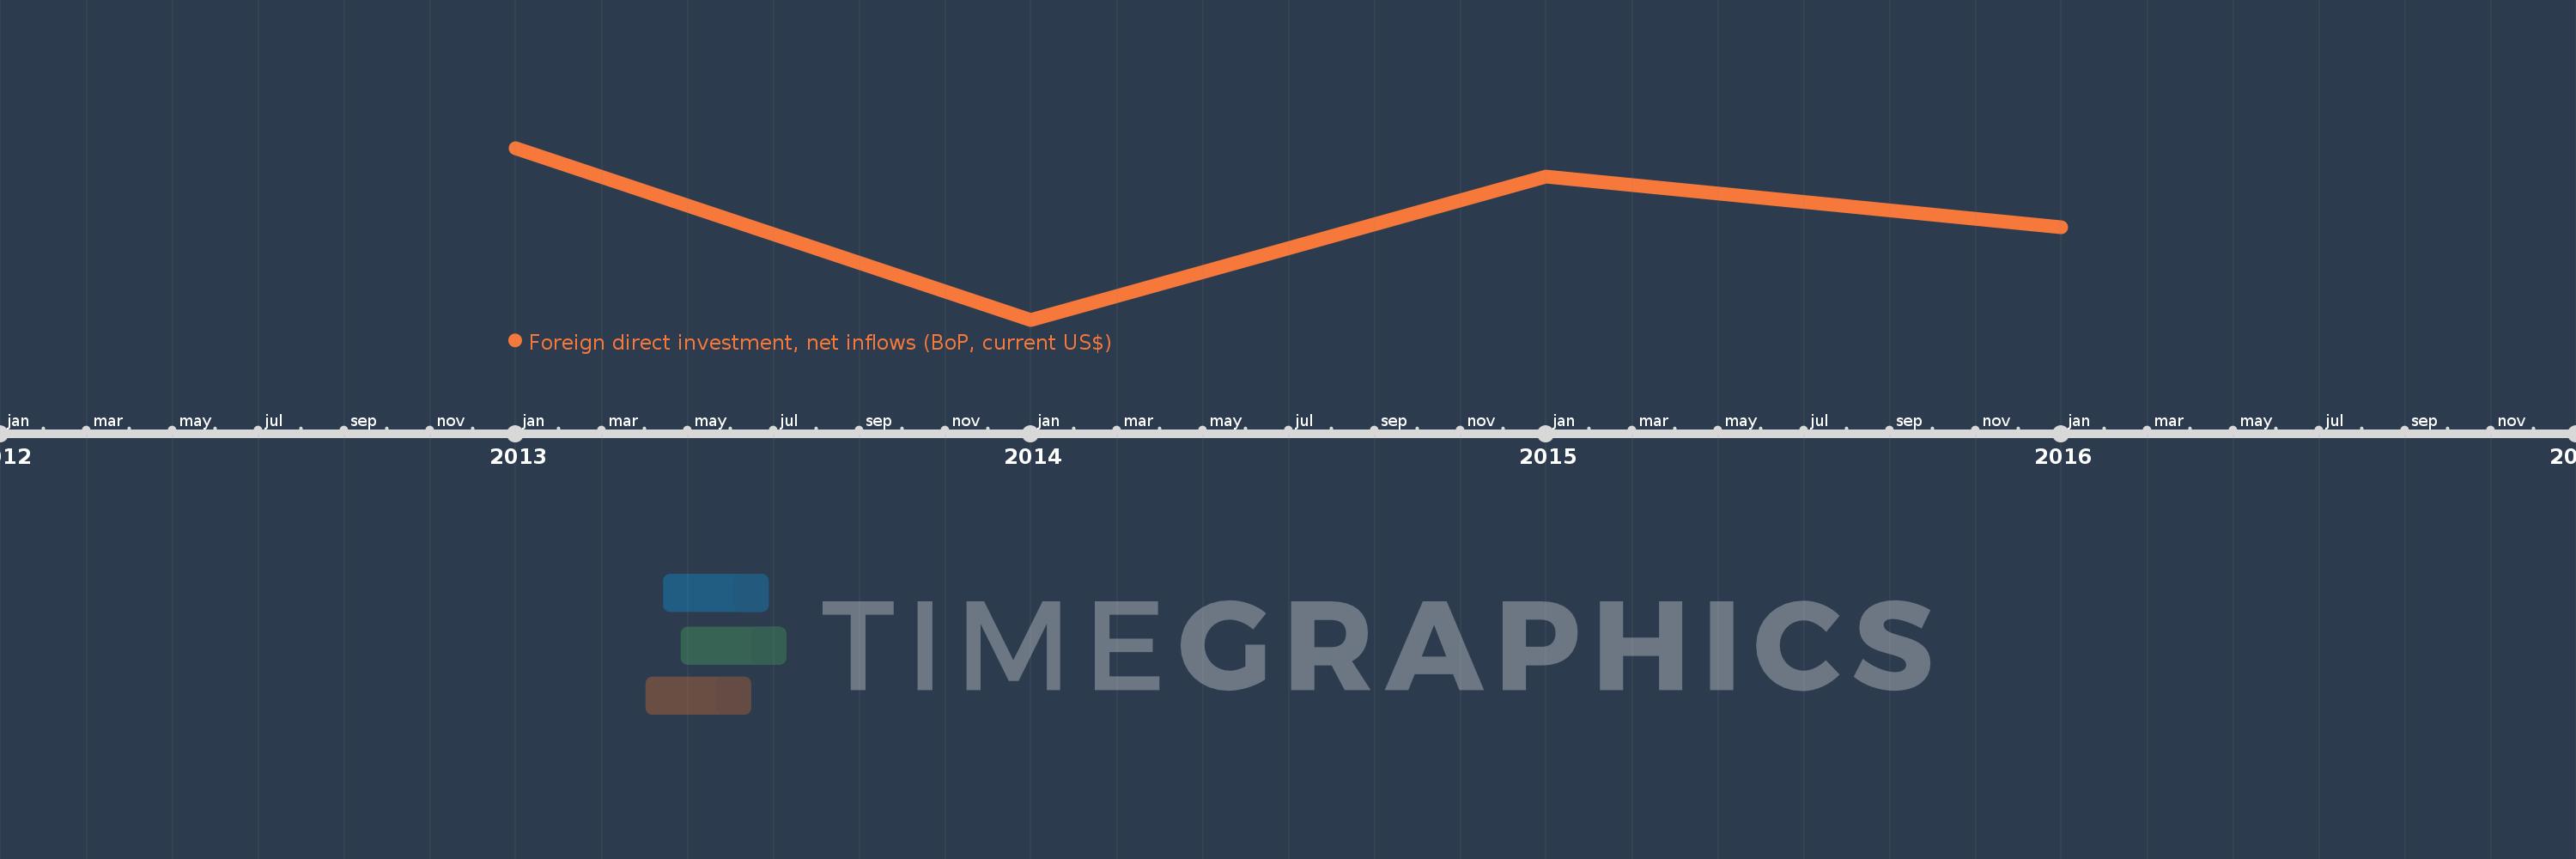
This timeline shows a graph from 2013 to 2016 of South Sudan. No data until 2012. Number of actual observations by date: 4.
Source name:
World Development Indicators
Source organization:
International Monetary Fund, Balance of Payments database, supplemented by data from the United Nations Conference on Trade and Development and official national sources.
Categories, topics:
Economy & Growth, Financial Sector, External Debt
Last updated:
apr 23, 2017
Indicators value changes by year
Meaning:
-226.991 mln
Minimum:
-793.0 mln
jan 1, 2014
Maximum:
161.0 mln
jan 1, 2013
At the date of observation
Value
Absolute change
Change from the previous value
jan 1, 2013
161.0 mln
+161.0 mln
0.0%
jan 1, 2014
-793.0 mln
-954.0 mln
-592.55%
jan 1, 2015
1.036 mln
+794.036 mln
-100.13%
jan 1, 2016
-277.0 mln
-278.036 mln
-26.84K%
Ranking of countries by current statistics by years