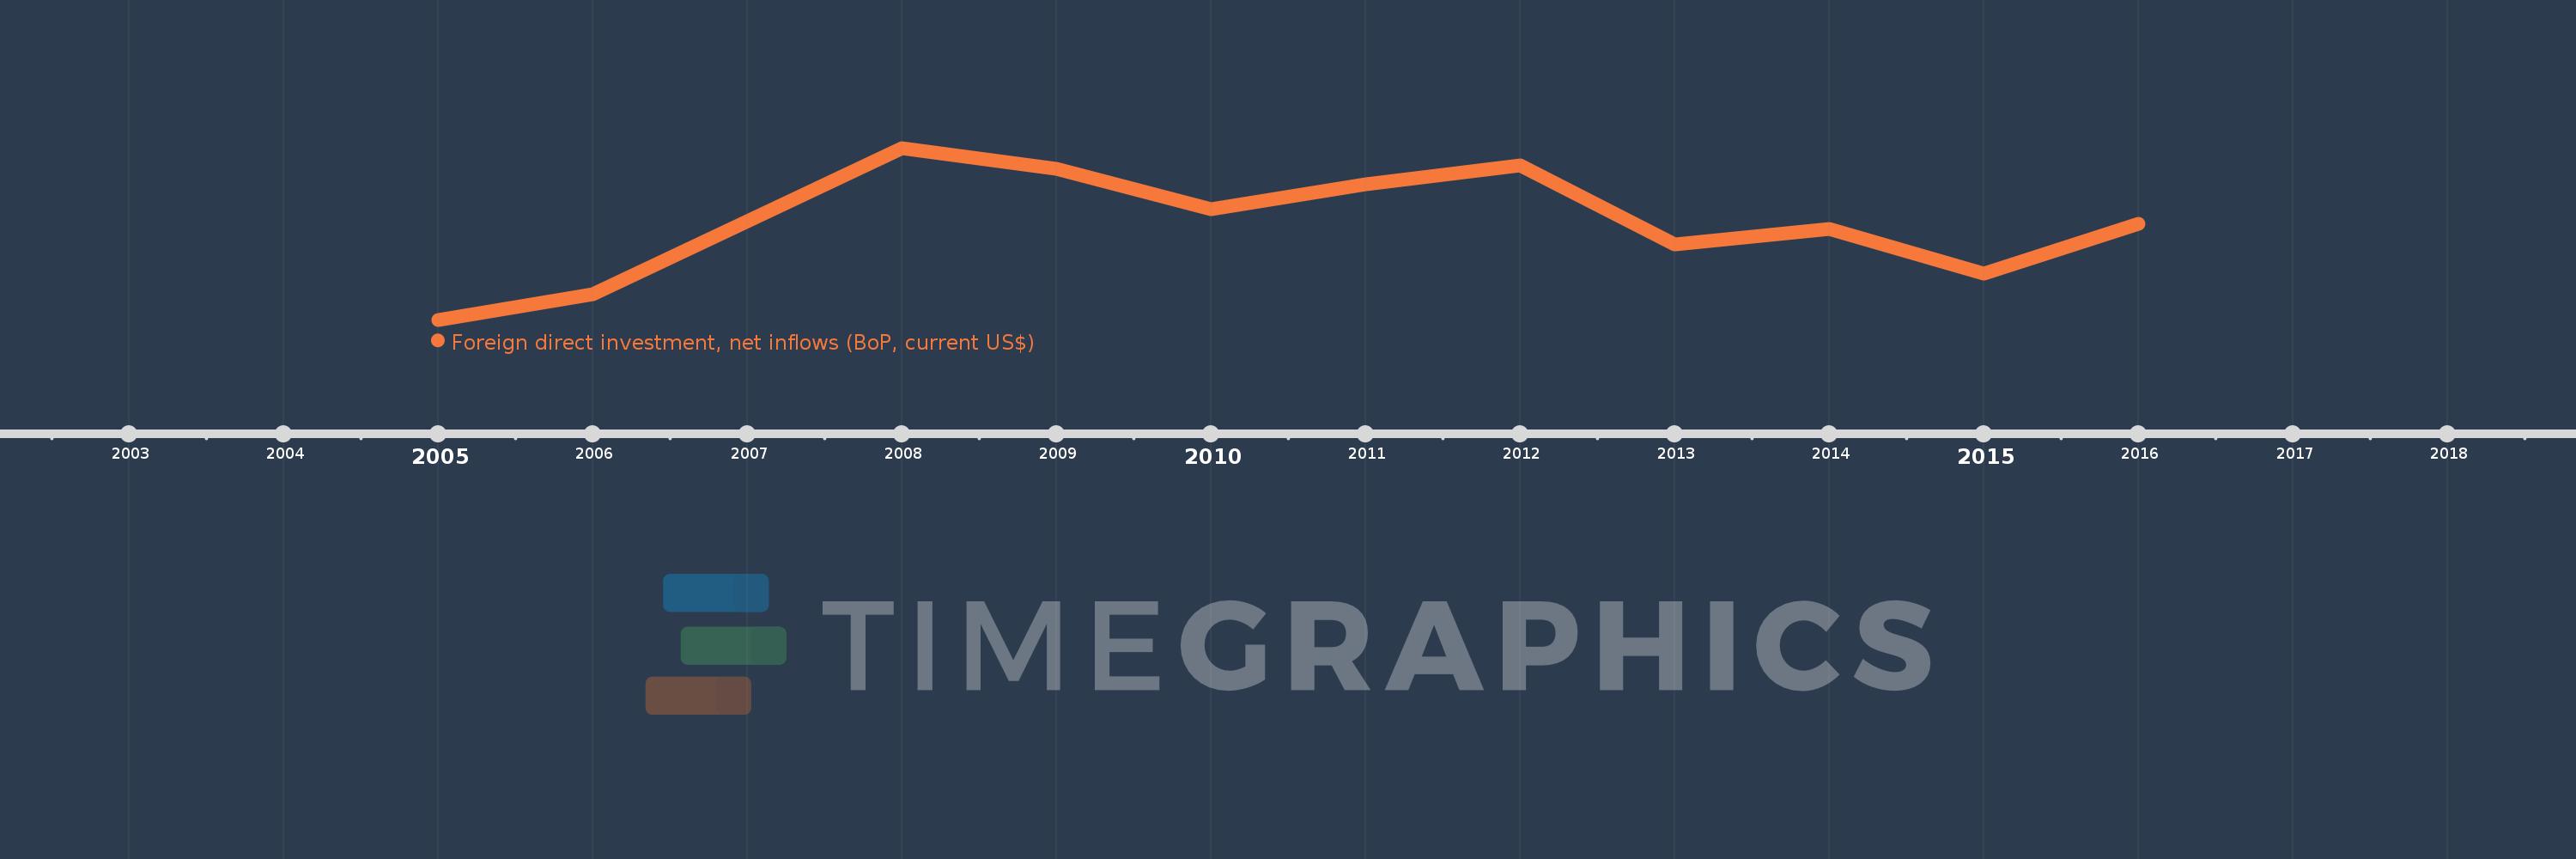
This timeline shows a graph from 2005 to 2016 of Kosovo. No data until 2004. Number of actual observations by date: 12.
Source name:
World Development Indicators
Source organization:
International Monetary Fund, Balance of Payments database, supplemented by data from the United Nations Conference on Trade and Development and official national sources.
Categories, topics:
Economy & Growth, Financial Sector, External Debt
Last updated:
apr 23, 2017
Indicators value changes by year
Meaning:
361.193 mln
Minimum:
53.29 mln
jan 1, 2005
Maximum:
603.224 mln
jan 1, 2008
At the date of observation
Value
Absolute change
Change from the previous value
jan 1, 2005
53.29 mln
+53.29 mln
0.0%
jan 1, 2006
133.824 mln
+80.534 mln
151.12%
jan 1, 2007
369.808 mln
+235.985 mln
176.34%
jan 1, 2008
603.224 mln
+233.416 mln
63.12%
jan 1, 2009
536.791 mln
-66.433 mln
-11.01%
jan 1, 2010
408.069 mln
-128.722 mln
-23.98%
jan 1, 2011
486.597 mln
+78.528 mln
19.24%
jan 1, 2012
546.217 mln
+59.62 mln
12.25%
jan 1, 2013
293.196 mln
-253.021 mln
-46.32%
jan 1, 2014
343.173 mln
+49.977 mln
17.05%
jan 1, 2015
199.794 mln
-143.379 mln
-41.78%
jan 1, 2016
360.337 mln
+160.543 mln
80.35%
Ranking of countries by current statistics by years