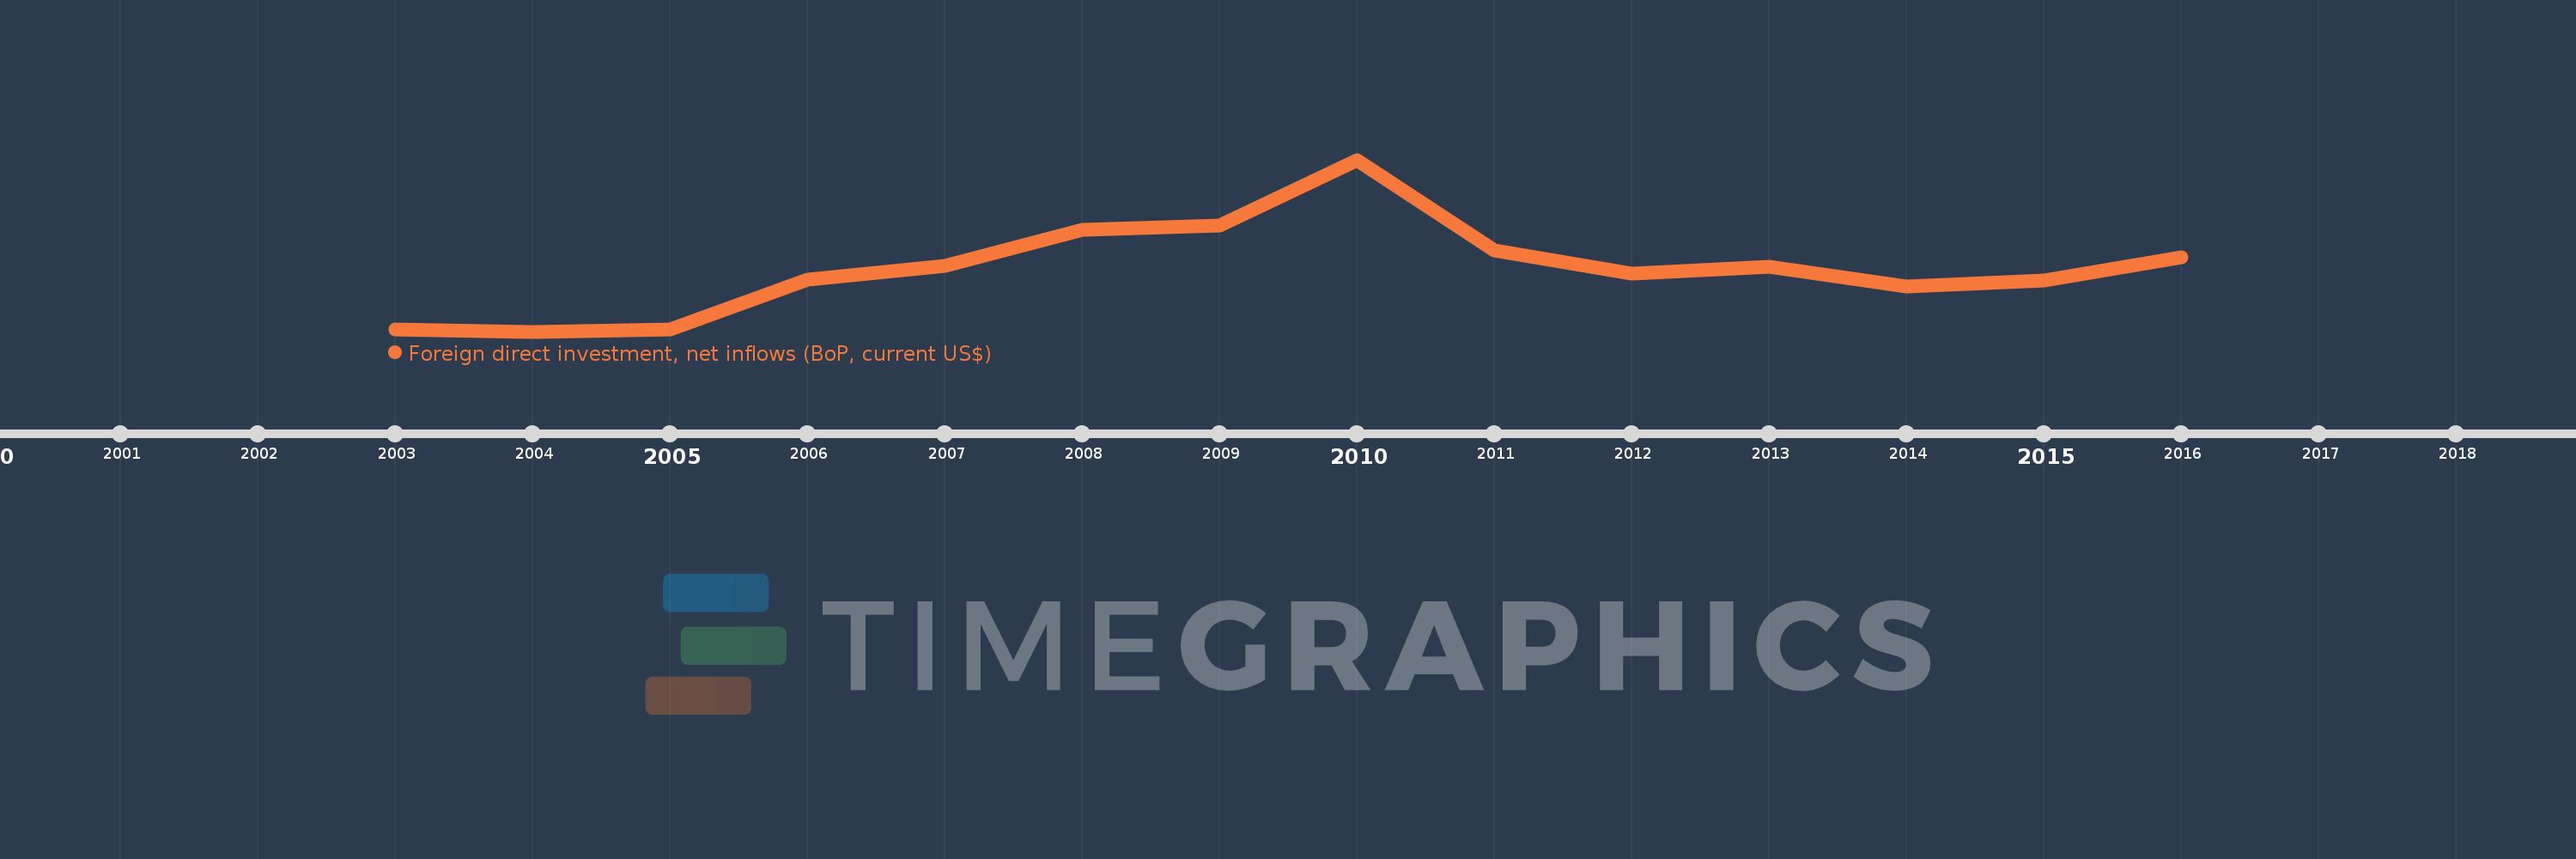
This timeline shows a graph from 2003 to 2016 of Montenegro. No data until 2002. Number of actual observations by date: 14.
Source name:
World Development Indicators
Source organization:
International Monetary Fund, Balance of Payments database, supplemented by data from the United Nations Conference on Trade and Development and official national sources.
Categories, topics:
Economy & Growth, Financial Sector, External Debt
Last updated:
apr 23, 2017
Indicators value changes by year
Meaning:
596.239 mln
Minimum:
49.431 mln
jan 1, 2004
Maximum:
1.549 bln
jan 1, 2010
At the date of observation
Value
Absolute change
Change from the previous value
jan 1, 2003
71.89 mln
+71.89 mln
0.0%
jan 1, 2004
49.431 mln
-22.459 mln
-31.24%
jan 1, 2005
65.377 mln
+15.945 mln
32.26%
jan 1, 2006
500.612 mln
+435.235 mln
665.74%
jan 1, 2007
622.002 mln
+121.39 mln
24.25%
jan 1, 2008
937.515 mln
+315.514 mln
50.73%
jan 1, 2009
975.106 mln
+37.59 mln
4.01%
jan 1, 2010
1.549 bln
+574.207 mln
58.89%
jan 1, 2011
758.407 mln
-790.905 mln
-51.05%
jan 1, 2012
556.258 mln
-202.15 mln
-26.65%
jan 1, 2013
618.367 mln
+62.109 mln
11.17%
jan 1, 2014
446.49 mln
-171.877 mln
-27.8%
jan 1, 2015
496.835 mln
+50.345 mln
11.28%
jan 1, 2016
699.737 mln
+202.901 mln
40.84%
Ranking of countries by current statistics by years