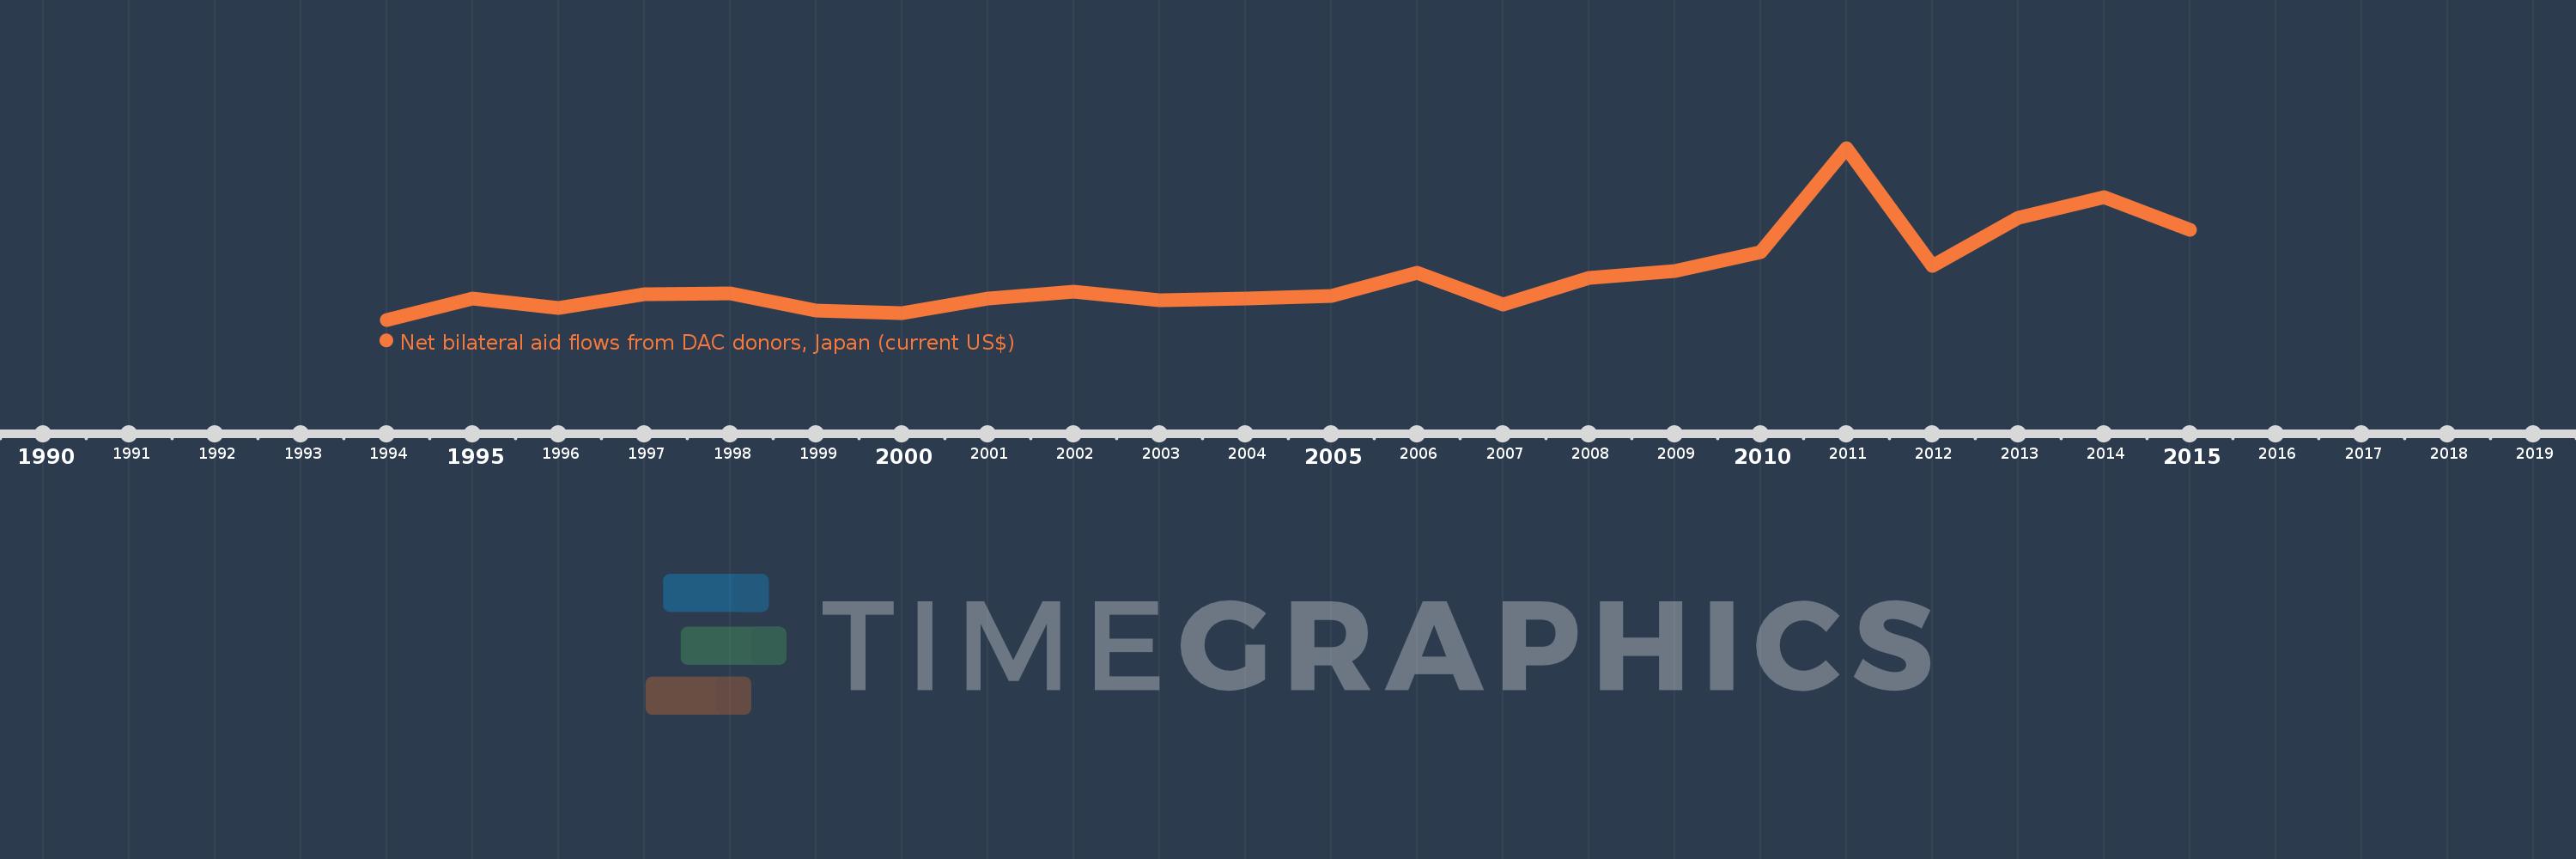
This timeline shows a graph from 1994 to 2015 of Belarus. No data until 1993. Number of actual observations by date: 22.
Source name:
World Development Indicators
Source organization:
Development Assistance Committee of the Organisation for Economic Co-operation and Development, Geographical Distribution of Financial Flows to Developing Countries, Development Co-operation Report, and International Development Statistics database. Data are available online at: www.oecd.org/dac/stats/idsonline.
Categories, topics:
Aid Effectiveness
Last updated:
apr 23, 2017
Indicators value changes by year
Meaning:
388.182K
Minimum:
40.0K
jan 1, 1994
Maximum:
1.39 mln
jan 1, 2011
At the date of observation
Value
Absolute change
Change from the previous value
jan 1, 1994
40.0K
+40.0K
0.0%
jan 1, 1995
210.0K
+170.0K
425.0%
jan 1, 1996
130.0K
-80.0K
-38.1%
jan 1, 1997
240.0K
+110.0K
84.62%
jan 1, 1998
250.0K
+10.0K
4.17%
jan 1, 1999
110.0K
-140.0K
-56.0%
jan 1, 2000
90.0K
-20.0K
-18.18%
jan 1, 2001
210.0K
+120.0K
133.33%
jan 1, 2002
260.0K
+50.0K
23.81%
jan 1, 2003
190.0K
-70.0K
-26.92%
jan 1, 2004
210.0K
+20.0K
10.53%
jan 1, 2005
230.0K
+20.0K
9.52%
jan 1, 2006
410.0K
+180.0K
78.26%
jan 1, 2007
160.0K
-250.0K
-60.98%
jan 1, 2008
370.0K
+210.0K
131.25%
jan 1, 2009
420.0K
+50.0K
13.51%
jan 1, 2010
570.0K
+150.0K
35.71%
jan 1, 2011
1.39 mln
+820.0K
143.86%
jan 1, 2012
460.0K
-930.0K
-66.91%
jan 1, 2013
840.0K
+380.0K
82.61%
jan 1, 2014
1000.0K
+160.0K
19.05%
jan 1, 2015
750.0K
-250.0K
-25.0%
Ranking of countries by current statistics by years