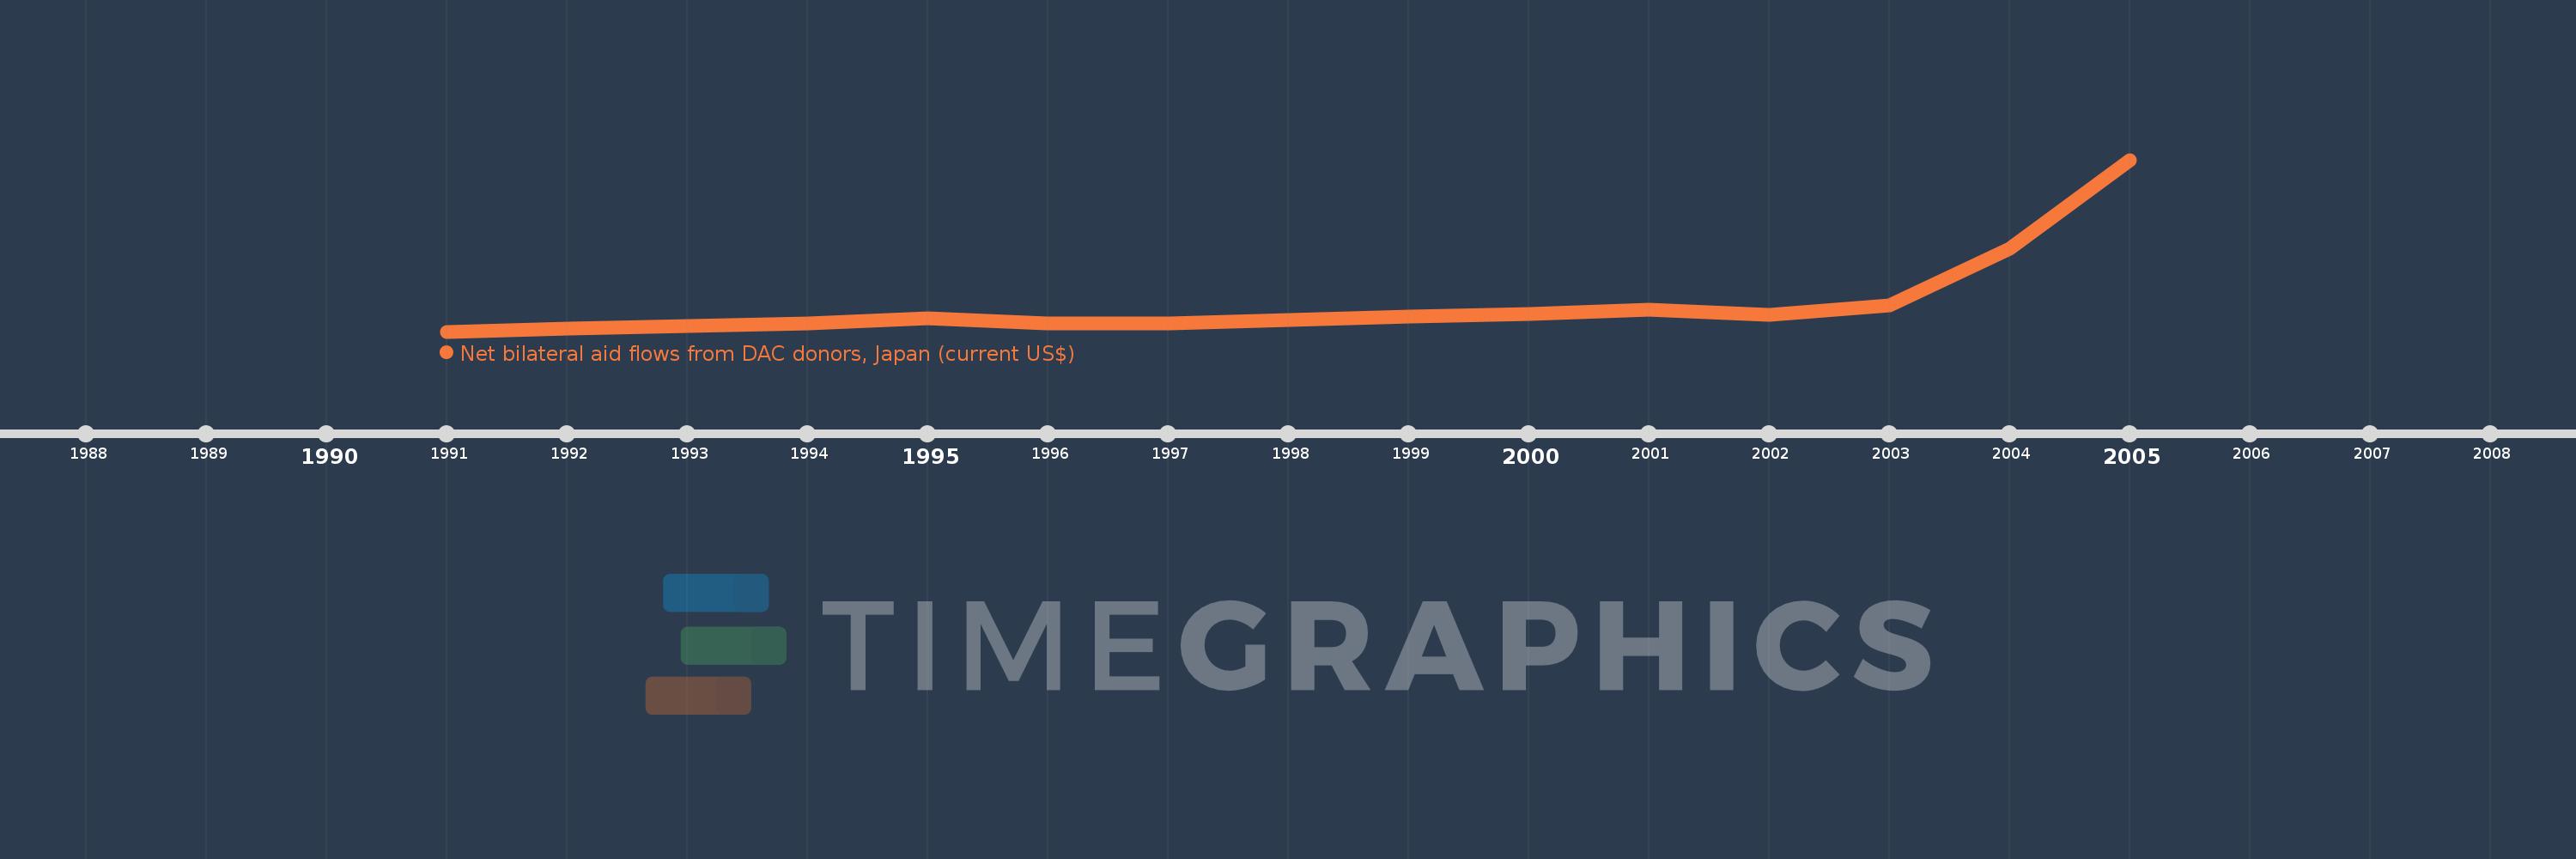
This timeline shows a graph from 1991 to 2005 of Slovak Republic. No data until 1990. Number of actual observations by date: 15.
Source name:
World Development Indicators
Source organization:
Development Assistance Committee of the Organisation for Economic Co-operation and Development, Geographical Distribution of Financial Flows to Developing Countries, Development Co-operation Report, and International Development Statistics database. Data are available online at: www.oecd.org/dac/stats/idsonline.
Categories, topics:
Aid Effectiveness
Last updated:
apr 23, 2017
Indicators value changes by year
Meaning:
3.755 mln
Minimum:
150.0K
jan 1, 1991
Maximum:
22.84 mln
jan 1, 2005
At the date of observation
Value
Absolute change
Change from the previous value
jan 1, 1991
150.0K
+150.0K
0.0%
jan 1, 1992
500.0K
+350.0K
233.33%
jan 1, 1993
900.0K
+400.0K
80.0%
jan 1, 1994
1.2 mln
+300.0K
33.33%
jan 1, 1995
1.89 mln
+690.0K
57.5%
jan 1, 1996
1.24 mln
-650.0K
-34.39%
jan 1, 1997
1.22 mln
-20.0K
-1.61%
jan 1, 1998
1.65 mln
+430.0K
35.25%
jan 1, 1999
2.11 mln
+460.0K
27.88%
jan 1, 2000
2.52 mln
+410.0K
19.43%
jan 1, 2001
3.04 mln
+520.0K
20.63%
jan 1, 2002
2.38 mln
-660.0K
-21.71%
jan 1, 2003
3.63 mln
+1.25 mln
52.52%
jan 1, 2004
11.06 mln
+7.43 mln
204.68%
jan 1, 2005
22.84 mln
+11.78 mln
106.51%
Ranking of countries by current statistics by years