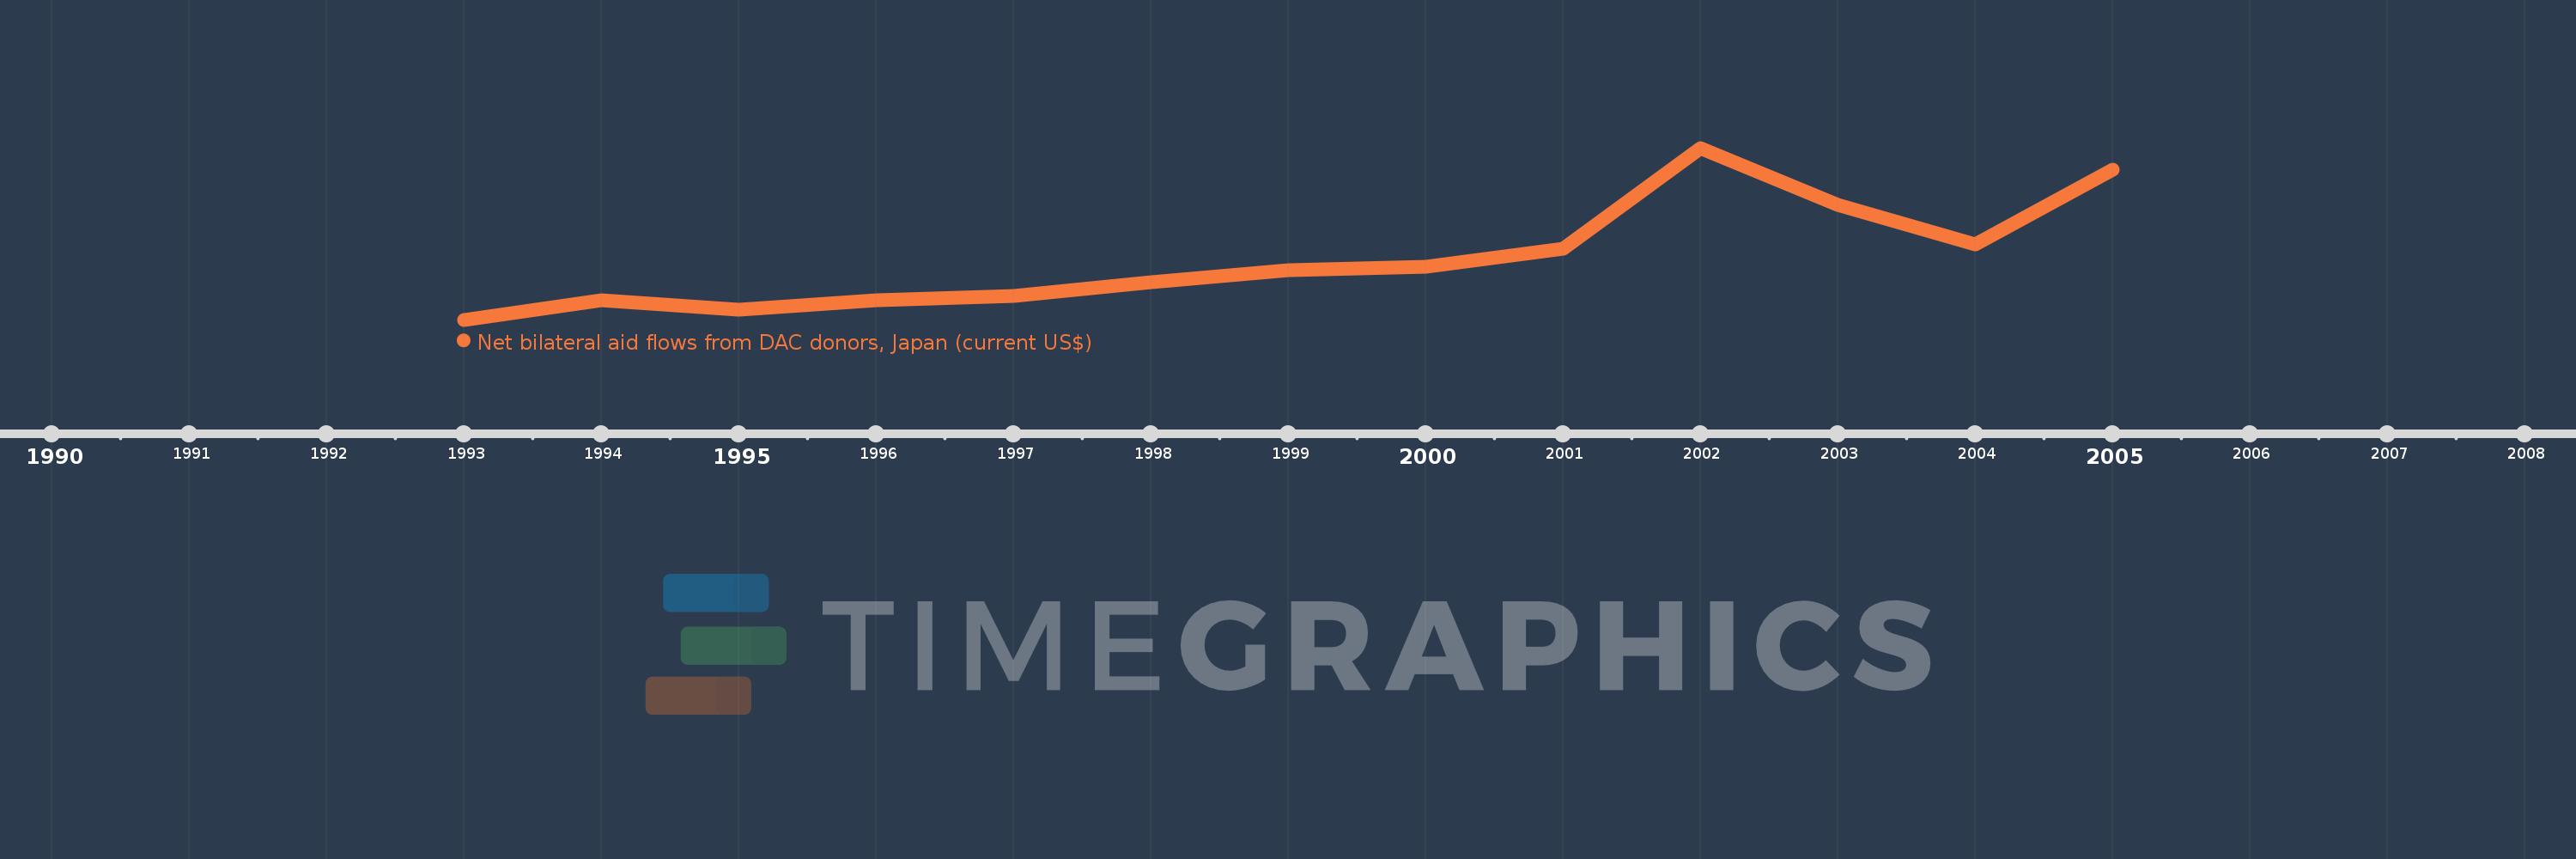
This timeline shows a graph from 1993 to 2005 of Estonia. No data until 1992. Number of actual observations by date: 13.
Source name:
World Development Indicators
Source organization:
Development Assistance Committee of the Organisation for Economic Co-operation and Development, Geographical Distribution of Financial Flows to Developing Countries, Development Co-operation Report, and International Development Statistics database. Data are available online at: www.oecd.org/dac/stats/idsonline.
Categories, topics:
Aid Effectiveness
Last updated:
apr 23, 2017
Indicators value changes by year
Meaning:
340.0K
Minimum:
30.0K
jan 1, 1993
Maximum:
900.0K
jan 1, 2002
At the date of observation
Value
Absolute change
Change from the previous value
jan 1, 1993
30.0K
+30.0K
0.0%
jan 1, 1994
130.0K
+100.0K
333.33%
jan 1, 1995
80.0K
-50.0K
-38.46%
jan 1, 1996
130.0K
+50.0K
62.5%
jan 1, 1997
150.0K
+20.0K
15.38%
jan 1, 1998
220.0K
+70.0K
46.67%
jan 1, 1999
280.0K
+60.0K
27.27%
jan 1, 2000
300.0K
+20.0K
7.14%
jan 1, 2001
390.0K
+90.0K
30.0%
jan 1, 2002
900.0K
+510.0K
130.77%
jan 1, 2003
610.0K
-290.0K
-32.22%
jan 1, 2004
410.0K
-200.0K
-32.79%
jan 1, 2005
790.0K
+380.0K
92.68%
Ranking of countries by current statistics by years