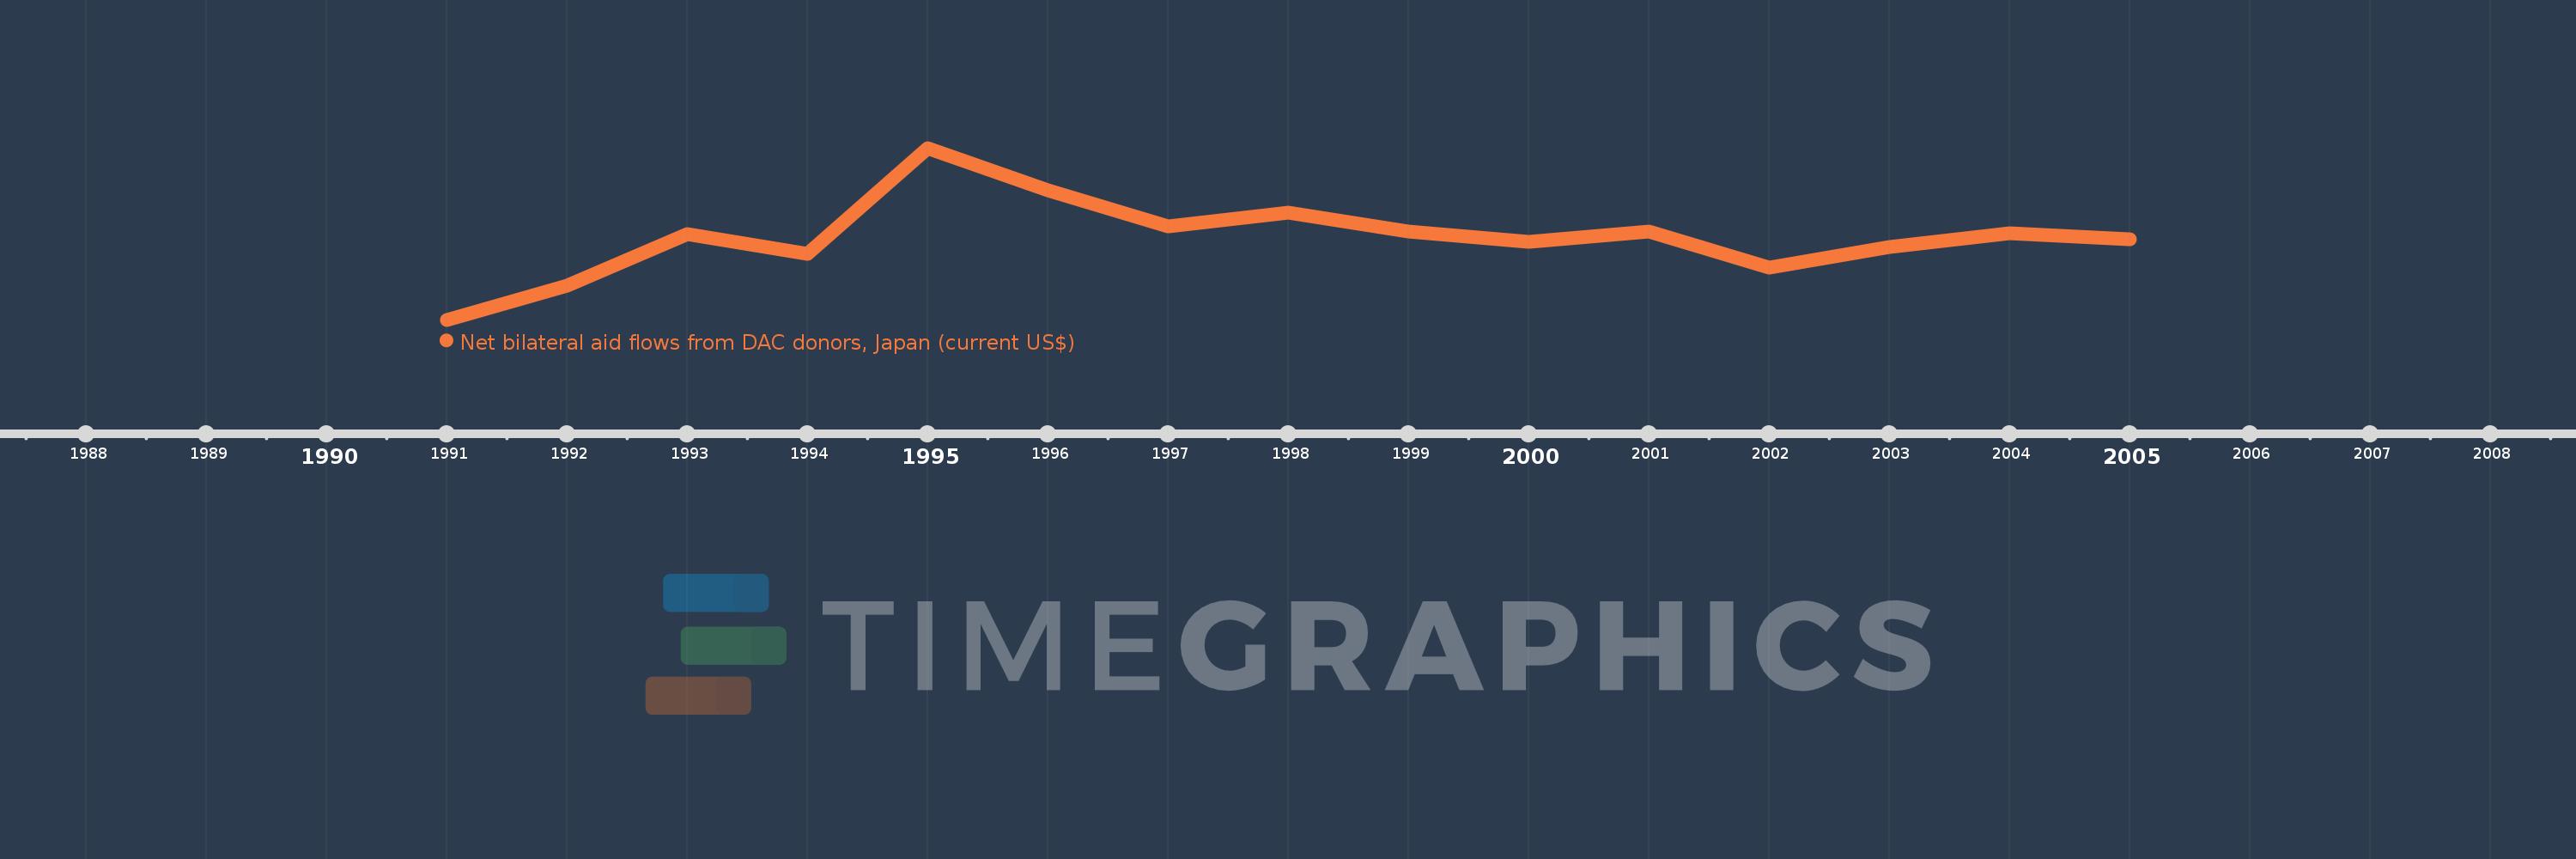
This timeline shows a graph from 1991 to 2005 of Czech Republic. No data until 1990. Number of actual observations by date: 15.
Source name:
World Development Indicators
Source organization:
Development Assistance Committee of the Organisation for Economic Co-operation and Development, Geographical Distribution of Financial Flows to Developing Countries, Development Co-operation Report, and International Development Statistics database. Data are available online at: www.oecd.org/dac/stats/idsonline.
Categories, topics:
Aid Effectiveness
Last updated:
apr 23, 2017
Indicators value changes by year
Meaning:
1.741 mln
Minimum:
300.0K
jan 1, 1991
Maximum:
3.31 mln
jan 1, 1995
At the date of observation
Value
Absolute change
Change from the previous value
jan 1, 1991
300.0K
+300.0K
0.0%
jan 1, 1992
900.0K
+600.0K
200.0%
jan 1, 1993
1.8 mln
+900.0K
100.0%
jan 1, 1994
1.46 mln
-340.0K
-18.89%
jan 1, 1995
3.31 mln
+1.85 mln
126.71%
jan 1, 1996
2.57 mln
-740.0K
-22.36%
jan 1, 1997
1.94 mln
-630.0K
-24.51%
jan 1, 1998
2.17 mln
+230.0K
11.86%
jan 1, 1999
1.85 mln
-320.0K
-14.75%
jan 1, 2000
1.67 mln
-180.0K
-9.73%
jan 1, 2001
1.84 mln
+170.0K
10.18%
jan 1, 2002
1.21 mln
-630.0K
-34.24%
jan 1, 2003
1.58 mln
+370.0K
30.58%
jan 1, 2004
1.81 mln
+230.0K
14.56%
jan 1, 2005
1.71 mln
-100.0K
-5.52%
Ranking of countries by current statistics by years