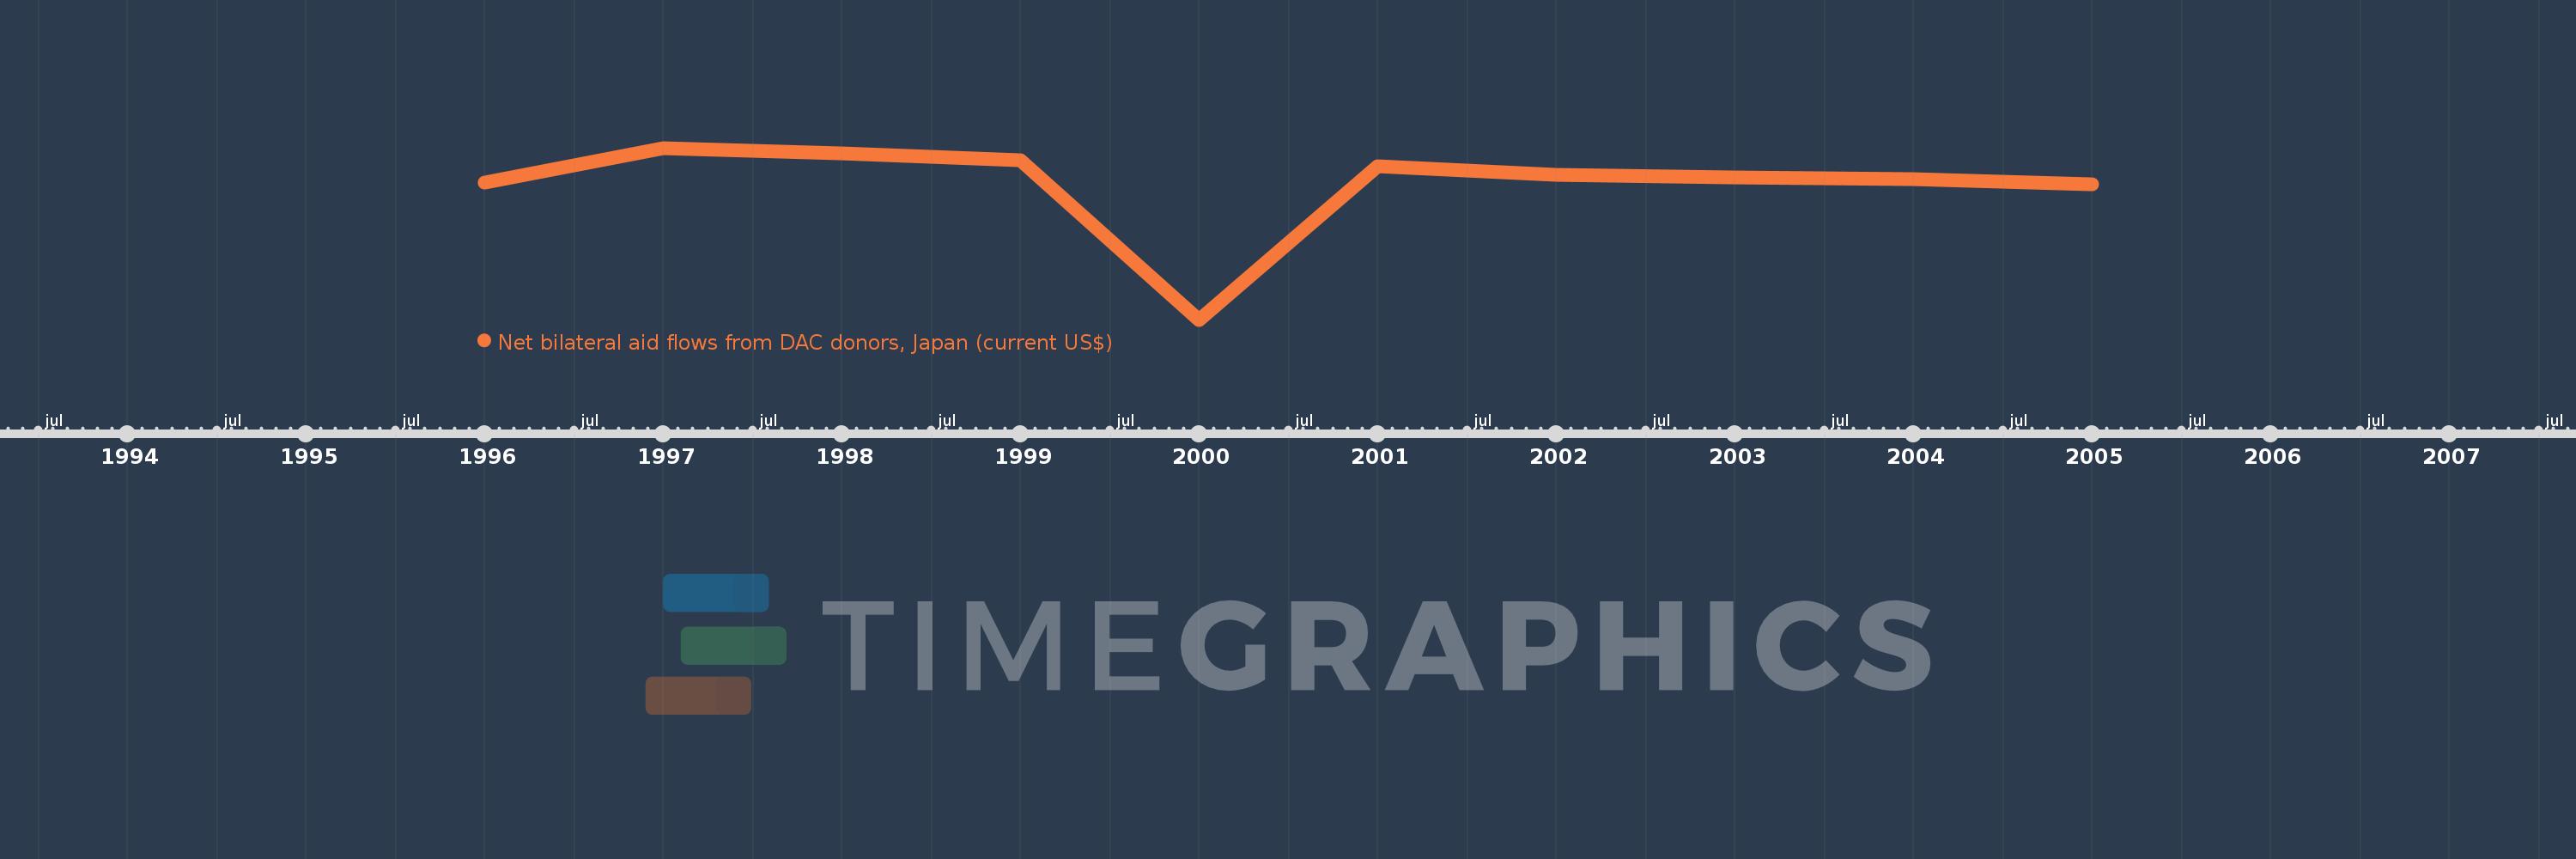
This timeline shows a graph from 1996 to 2005 of Slovenia. No data until 1995. Number of actual observations by date: 10.
Source name:
World Development Indicators
Source organization:
Development Assistance Committee of the Organisation for Economic Co-operation and Development, Geographical Distribution of Financial Flows to Developing Countries, Development Co-operation Report, and International Development Statistics database. Data are available online at: www.oecd.org/dac/stats/idsonline.
Categories, topics:
Aid Effectiveness
Last updated:
apr 23, 2017
Indicators value changes by year
Meaning:
76.0K
Minimum:
-3.85 mln
jan 1, 2000
Maximum:
1.14 mln
jan 1, 1997
At the date of observation
Value
Absolute change
Change from the previous value
jan 1, 1996
140.0K
+140.0K
0.0%
jan 1, 1997
1.14 mln
+1000.0K
714.29%
jan 1, 1998
980.0K
-160.0K
-14.04%
jan 1, 1999
780.0K
-200.0K
-20.41%
jan 1, 2000
-3.85 mln
-4.63 mln
-593.59%
jan 1, 2001
600.0K
+4.45 mln
-115.58%
jan 1, 2002
370.0K
-230.0K
-38.33%
jan 1, 2003
280.0K
-90.0K
-24.32%
jan 1, 2004
230.0K
-50.0K
-17.86%
jan 1, 2005
90.0K
-140.0K
-60.87%
Ranking of countries by current statistics by years