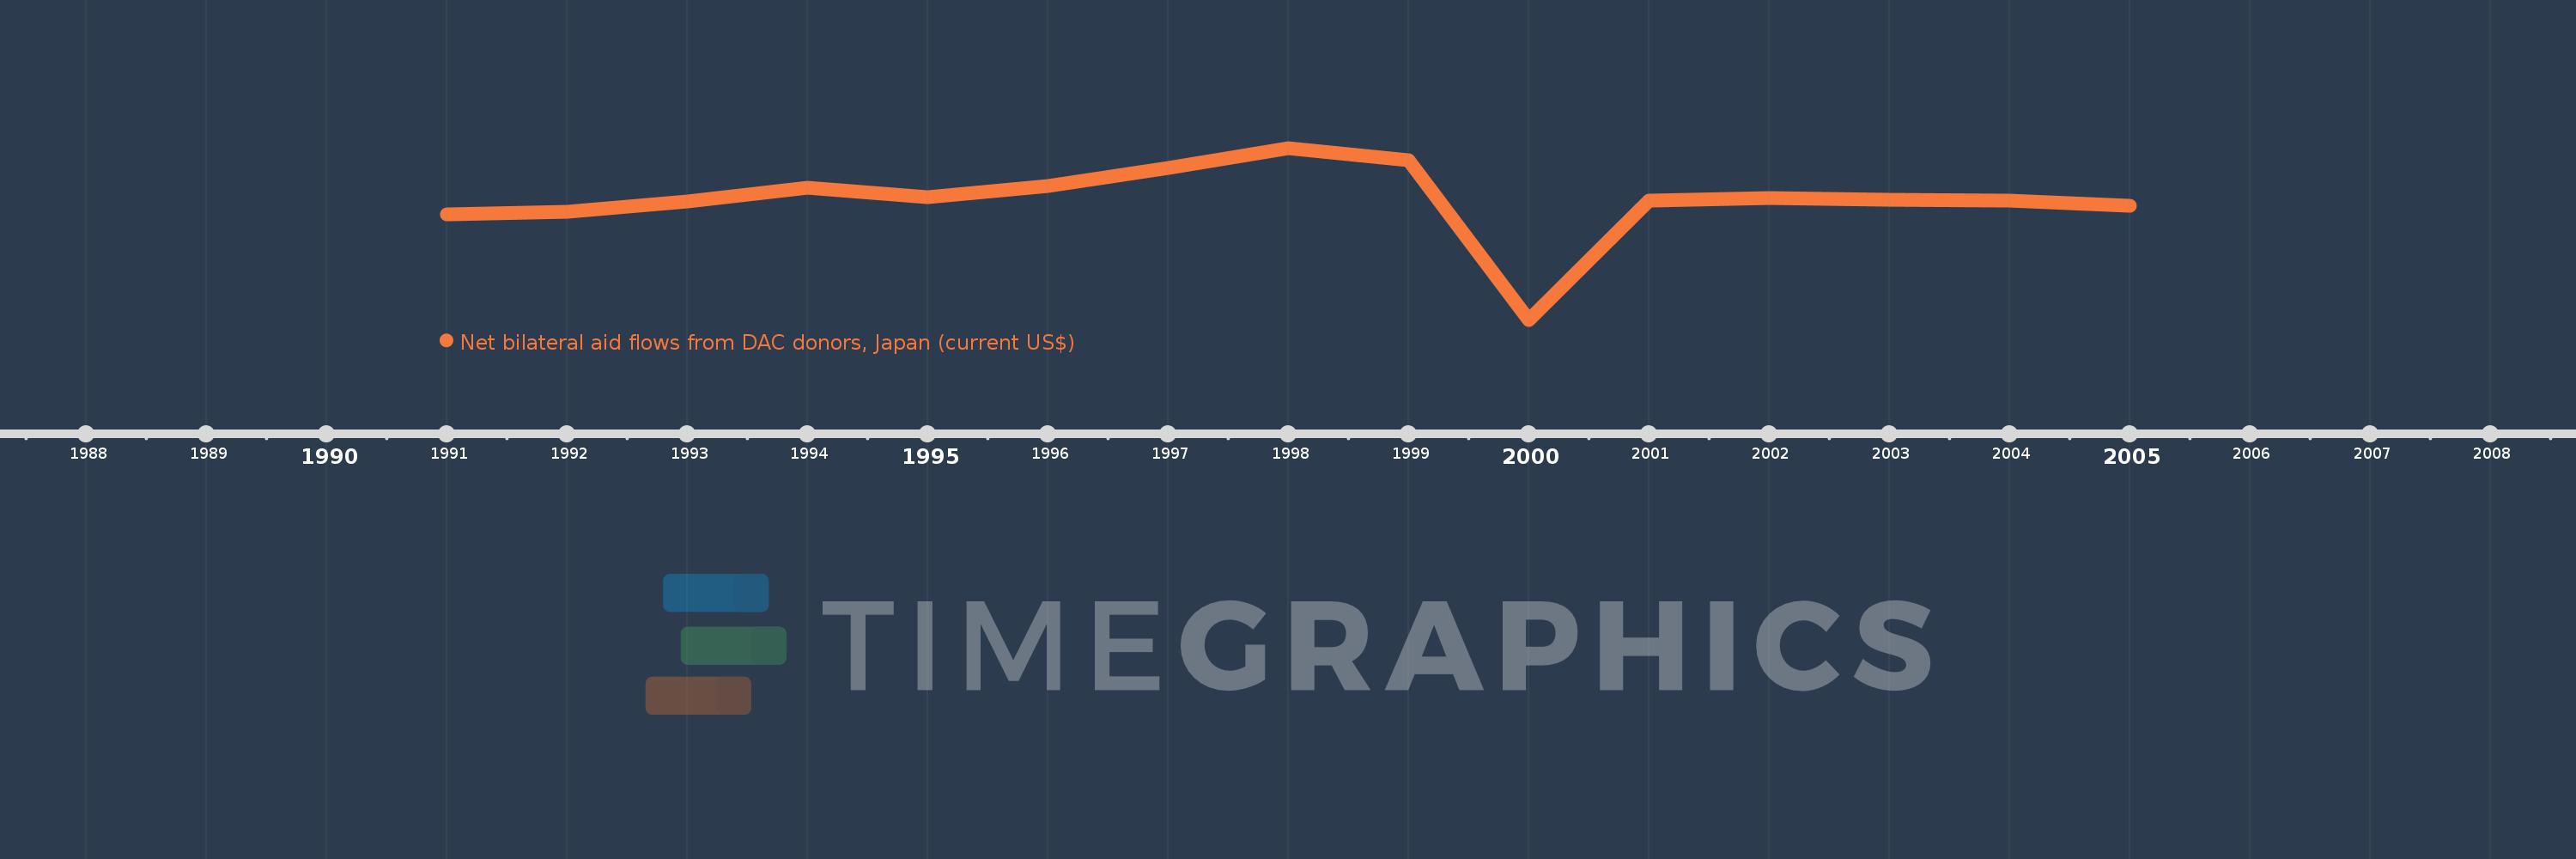
This timeline shows a graph from 1991 to 2005 of Hungary. No data until 1990. Number of actual observations by date: 15.
Source name:
World Development Indicators
Source organization:
Development Assistance Committee of the Organisation for Economic Co-operation and Development, Geographical Distribution of Financial Flows to Developing Countries, Development Co-operation Report, and International Development Statistics database. Data are available online at: www.oecd.org/dac/stats/idsonline.
Categories, topics:
Aid Effectiveness
Last updated:
apr 23, 2017
Indicators value changes by year
Meaning:
6.741 mln
Minimum:
-33.56 mln
jan 1, 2000
Maximum:
24.2 mln
jan 1, 1998
At the date of observation
Value
Absolute change
Change from the previous value
jan 1, 1991
1.97 mln
+1.97 mln
0.0%
jan 1, 1992
2.75 mln
+780.0K
39.59%
jan 1, 1993
6.15 mln
+3.4 mln
123.64%
jan 1, 1994
10.72 mln
+4.57 mln
74.31%
jan 1, 1995
7.76 mln
-2.96 mln
-27.61%
jan 1, 1996
11.38 mln
+3.62 mln
46.65%
jan 1, 1997
17.48 mln
+6.1 mln
53.6%
jan 1, 1998
24.2 mln
+6.72 mln
38.44%
jan 1, 1999
20.05 mln
-4.15 mln
-17.15%
jan 1, 2000
-33.56 mln
-53.61 mln
-267.38%
jan 1, 2001
6.6 mln
+40.16 mln
-119.67%
jan 1, 2002
7.42 mln
+820.0K
12.42%
jan 1, 2003
6.89 mln
-530.0K
-7.14%
jan 1, 2004
6.58 mln
-310.0K
-4.5%
jan 1, 2005
4.72 mln
-1.86 mln
-28.27%
Ranking of countries by current statistics by years