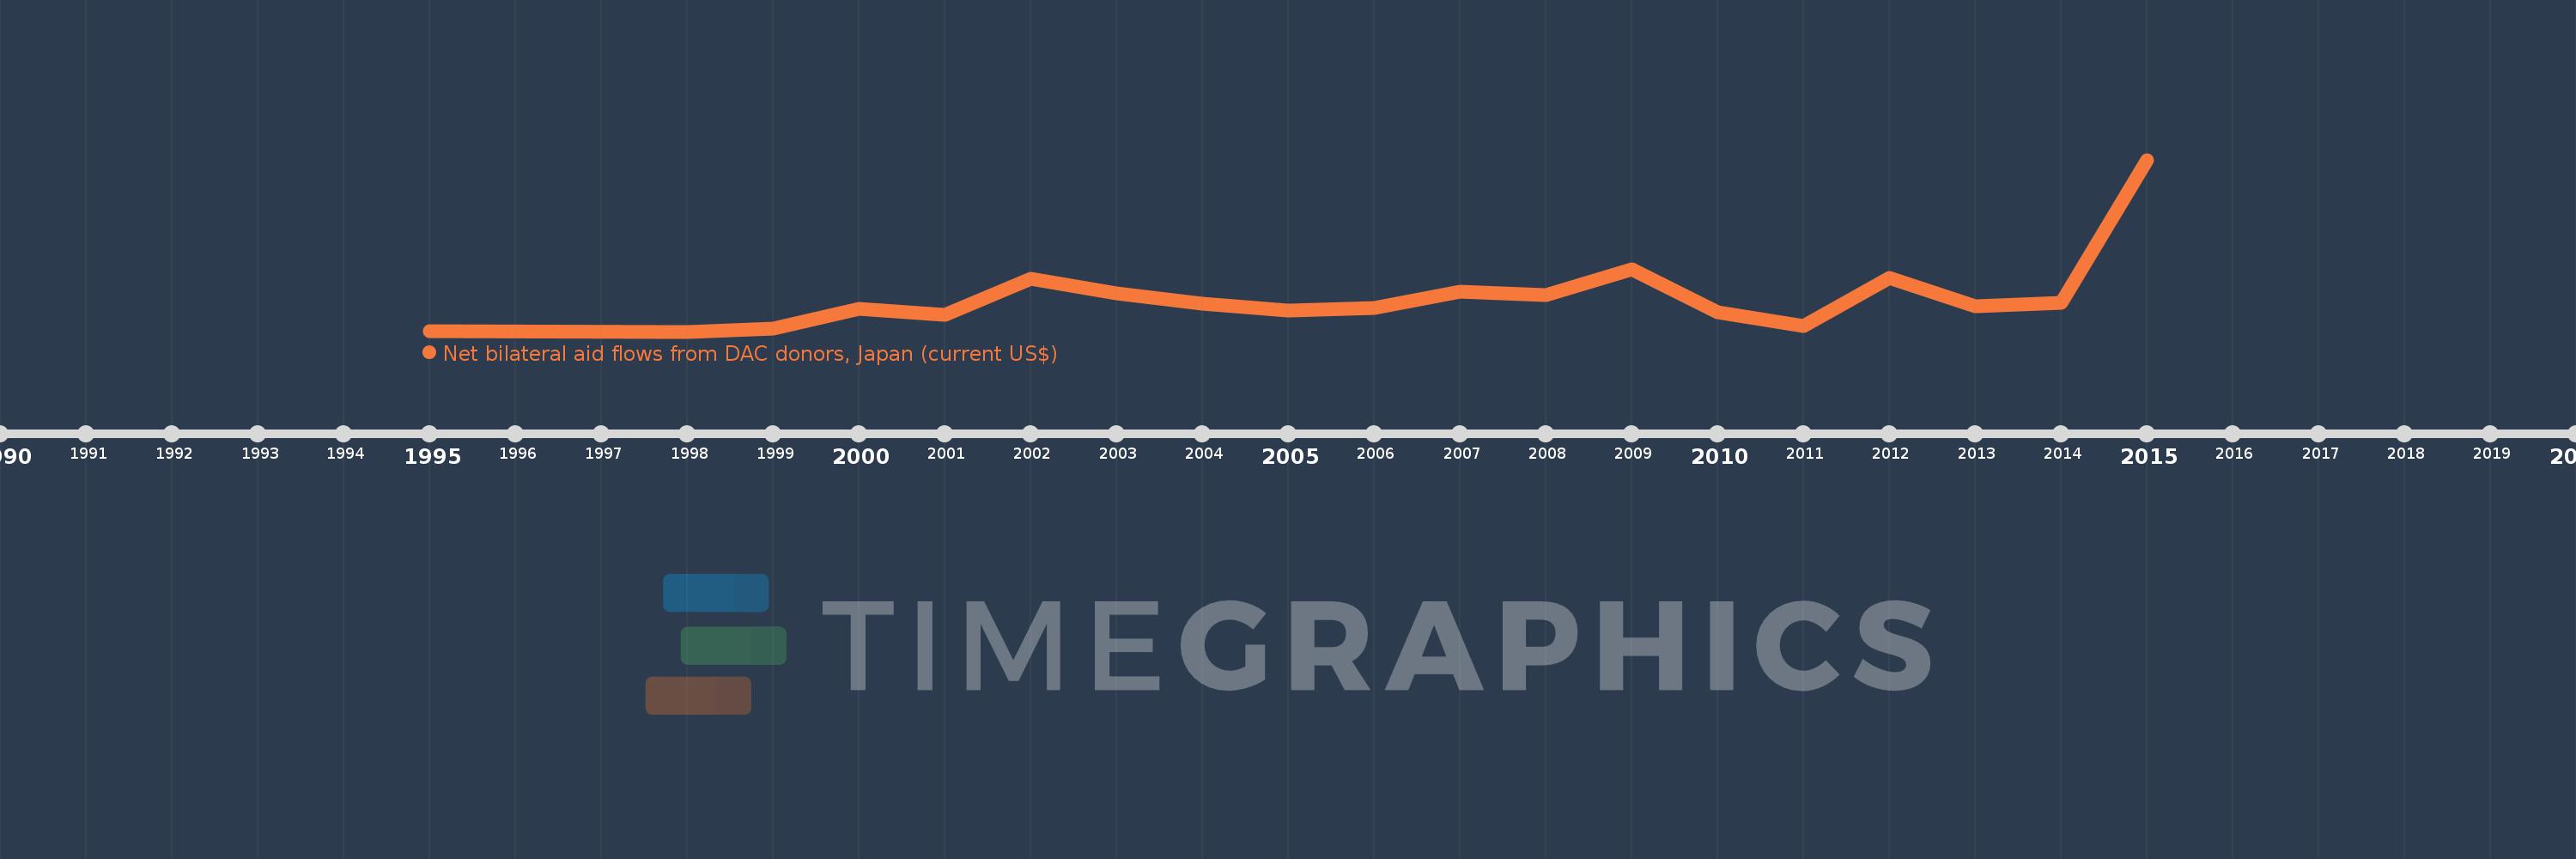
This timeline shows a graph from 1995 to 2015 of Moldova. No data until 1994. Number of actual observations by date: 19.
Source name:
World Development Indicators
Source organization:
Development Assistance Committee of the Organisation for Economic Co-operation and Development, Geographical Distribution of Financial Flows to Developing Countries, Development Co-operation Report, and International Development Statistics database. Data are available online at: www.oecd.org/dac/stats/idsonline.
Categories, topics:
Aid Effectiveness
Last updated:
apr 23, 2017
Indicators value changes by year
Meaning:
5.293 mln
Minimum:
60.0K
jan 1, 1998
Maximum:
26.3 mln
jan 1, 2015
At the date of observation
Value
Absolute change
Change from the previous value
jan 1, 1995
120.0K
+120.0K
0.0%
jan 1, 1998
60.0K
-60.0K
-50.0%
jan 1, 1999
490.0K
+430.0K
716.67%
jan 1, 2000
3.52 mln
+3.03 mln
618.37%
jan 1, 2001
2.63 mln
-890.0K
-25.28%
jan 1, 2002
8.15 mln
+5.52 mln
209.89%
jan 1, 2003
5.91 mln
-2.24 mln
-27.48%
jan 1, 2004
4.3 mln
-1.61 mln
-27.24%
jan 1, 2005
3.33 mln
-970.0K
-22.56%
jan 1, 2006
3.71 mln
+380.0K
11.41%
jan 1, 2007
6.11 mln
+2.4 mln
64.69%
jan 1, 2008
5.7 mln
-410.0K
-6.71%
jan 1, 2009
9.58 mln
+3.88 mln
68.07%
jan 1, 2010
3.07 mln
-6.51 mln
-67.95%
jan 1, 2011
930.0K
-2.14 mln
-69.71%
jan 1, 2012
8.28 mln
+7.35 mln
790.32%
jan 1, 2013
3.96 mln
-4.32 mln
-52.17%
jan 1, 2014
4.42 mln
+460.0K
11.62%
jan 1, 2015
26.3 mln
+21.88 mln
495.02%
Ranking of countries by current statistics by years