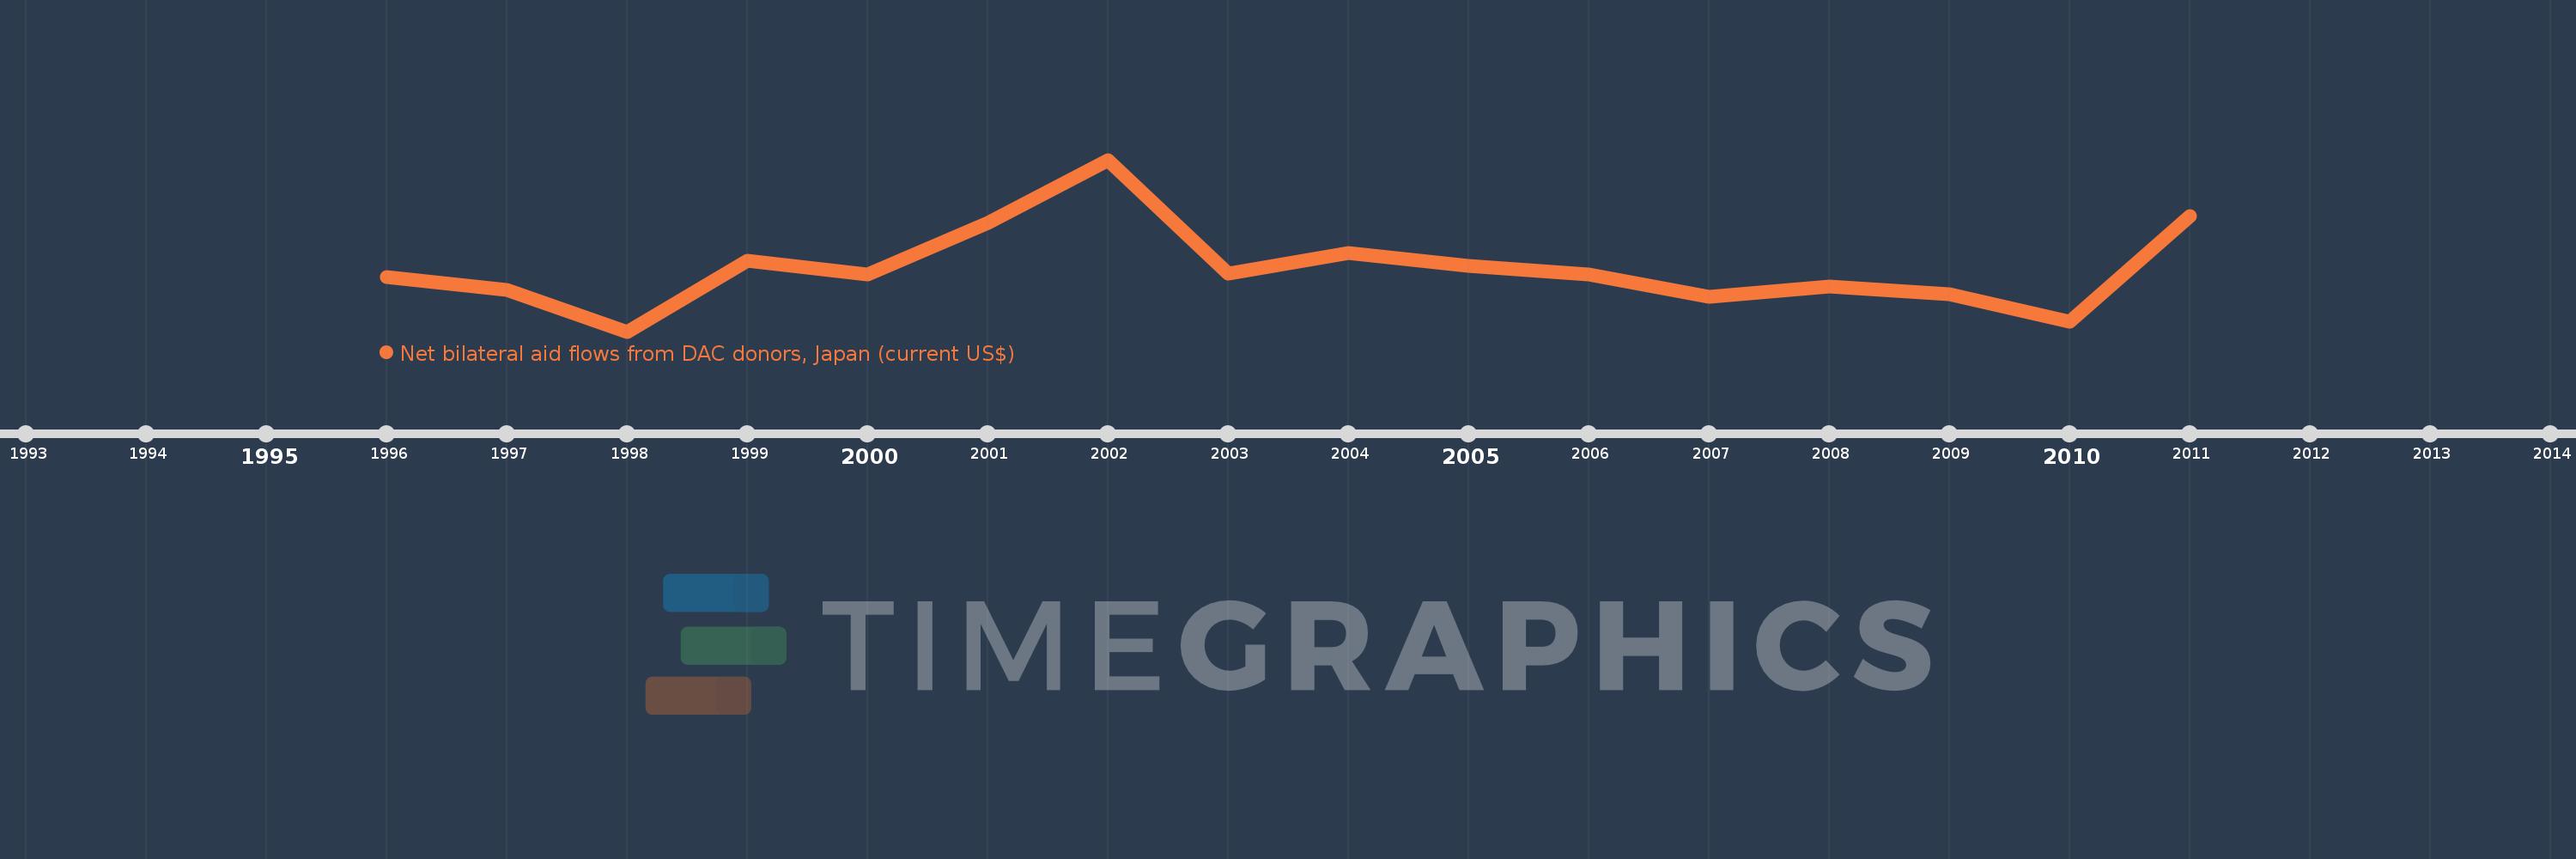
This timeline shows a graph from 1996 to 2011 of Croatia. No data until 1995. Number of actual observations by date: 16.
Source name:
World Development Indicators
Source organization:
Development Assistance Committee of the Organisation for Economic Co-operation and Development, Geographical Distribution of Financial Flows to Developing Countries, Development Co-operation Report, and International Development Statistics database. Data are available online at: www.oecd.org/dac/stats/idsonline.
Categories, topics:
Aid Effectiveness
Last updated:
apr 23, 2017
Indicators value changes by year
Meaning:
623.75K
Minimum:
-890.0K
jan 1, 1998
Maximum:
3.24 mln
jan 1, 2002
At the date of observation
Value
Absolute change
Change from the previous value
jan 1, 1996
430.0K
+430.0K
0.0%
jan 1, 1997
120.0K
-310.0K
-72.09%
jan 1, 1998
-890.0K
-1.01 mln
-841.67%
jan 1, 1999
820.0K
+1.71 mln
-192.13%
jan 1, 2000
490.0K
-330.0K
-40.24%
jan 1, 2001
1.73 mln
+1.24 mln
253.06%
jan 1, 2002
3.24 mln
+1.51 mln
87.28%
jan 1, 2003
510.0K
-2.73 mln
-84.26%
jan 1, 2004
1000.0K
+490.0K
96.08%
jan 1, 2005
690.0K
-310.0K
-31.0%
jan 1, 2006
480.0K
-210.0K
-30.43%
jan 1, 2007
-60.0K
-540.0K
-112.5%
jan 1, 2008
190.0K
+250.0K
-416.67%
jan 1, 2009
10.0K
-180.0K
-94.74%
jan 1, 2010
-660.0K
-670.0K
-6.7K%
jan 1, 2011
1.88 mln
+2.54 mln
-384.85%
Ranking of countries by current statistics by years