33
/
AIzaSyB4mHJ5NPEv-XzF7P6NDYXjlkCWaeKw5bc
November 30, 2025
70293
Argentina
ARG
true
2
1
PNG, bonds (INT, current US$)
2016,2015,2014,2013,2012,2011,2010,2009,2008,2007,2006,2005,2002,2001,2000,1999,1998,1997,1996,1995,1994,1993,1992
Create a timeline
Public Timelines
For education
For educational institutions
For teachers
For students
Cabinet
For educational institutions
For teachers
For students
Open cabinet
FAQ
Close
Create a timeline
Public timelines
FAQ
About & Feedback
Terms
Privacy
FAQ
Support 24/7
Cabinet
Get premium
Donate
Download
Global statistics library
→
Argentina
→
PNG, bonds (INT, current US$)
This statistics in other country:
Argentina
Botswana
Brazil
Bulgaria
China
Colombia
Costa Rica
Dominican Republic
East Asia & Pacific (excluding high income)
Ecuador
Egypt, Arab Rep.
El Salvador
Europe & Central Asia (excluding high income)
Georgia
Ghana
Guatemala
IDA only
India
Indonesia
Jamaica
Kazakhstan
Lao PDR
Latin America & Caribbean (excluding high income)
Lebanon
Low & middle income
Lower middle income
Malaysia
Mexico
Middle East & North Africa (excluding high income)
Middle income
Mongolia
Nigeria
Pakistan
Panama
Paraguay
Peru
Philippines
Romania
Russian Federation
Serbia
South Africa
South Asia
Sri Lanka
Sub-Saharan Africa (excluding high income)
Thailand
Turkey
Ukraine
Upper middle income
Venezuela, RB
Vietnam
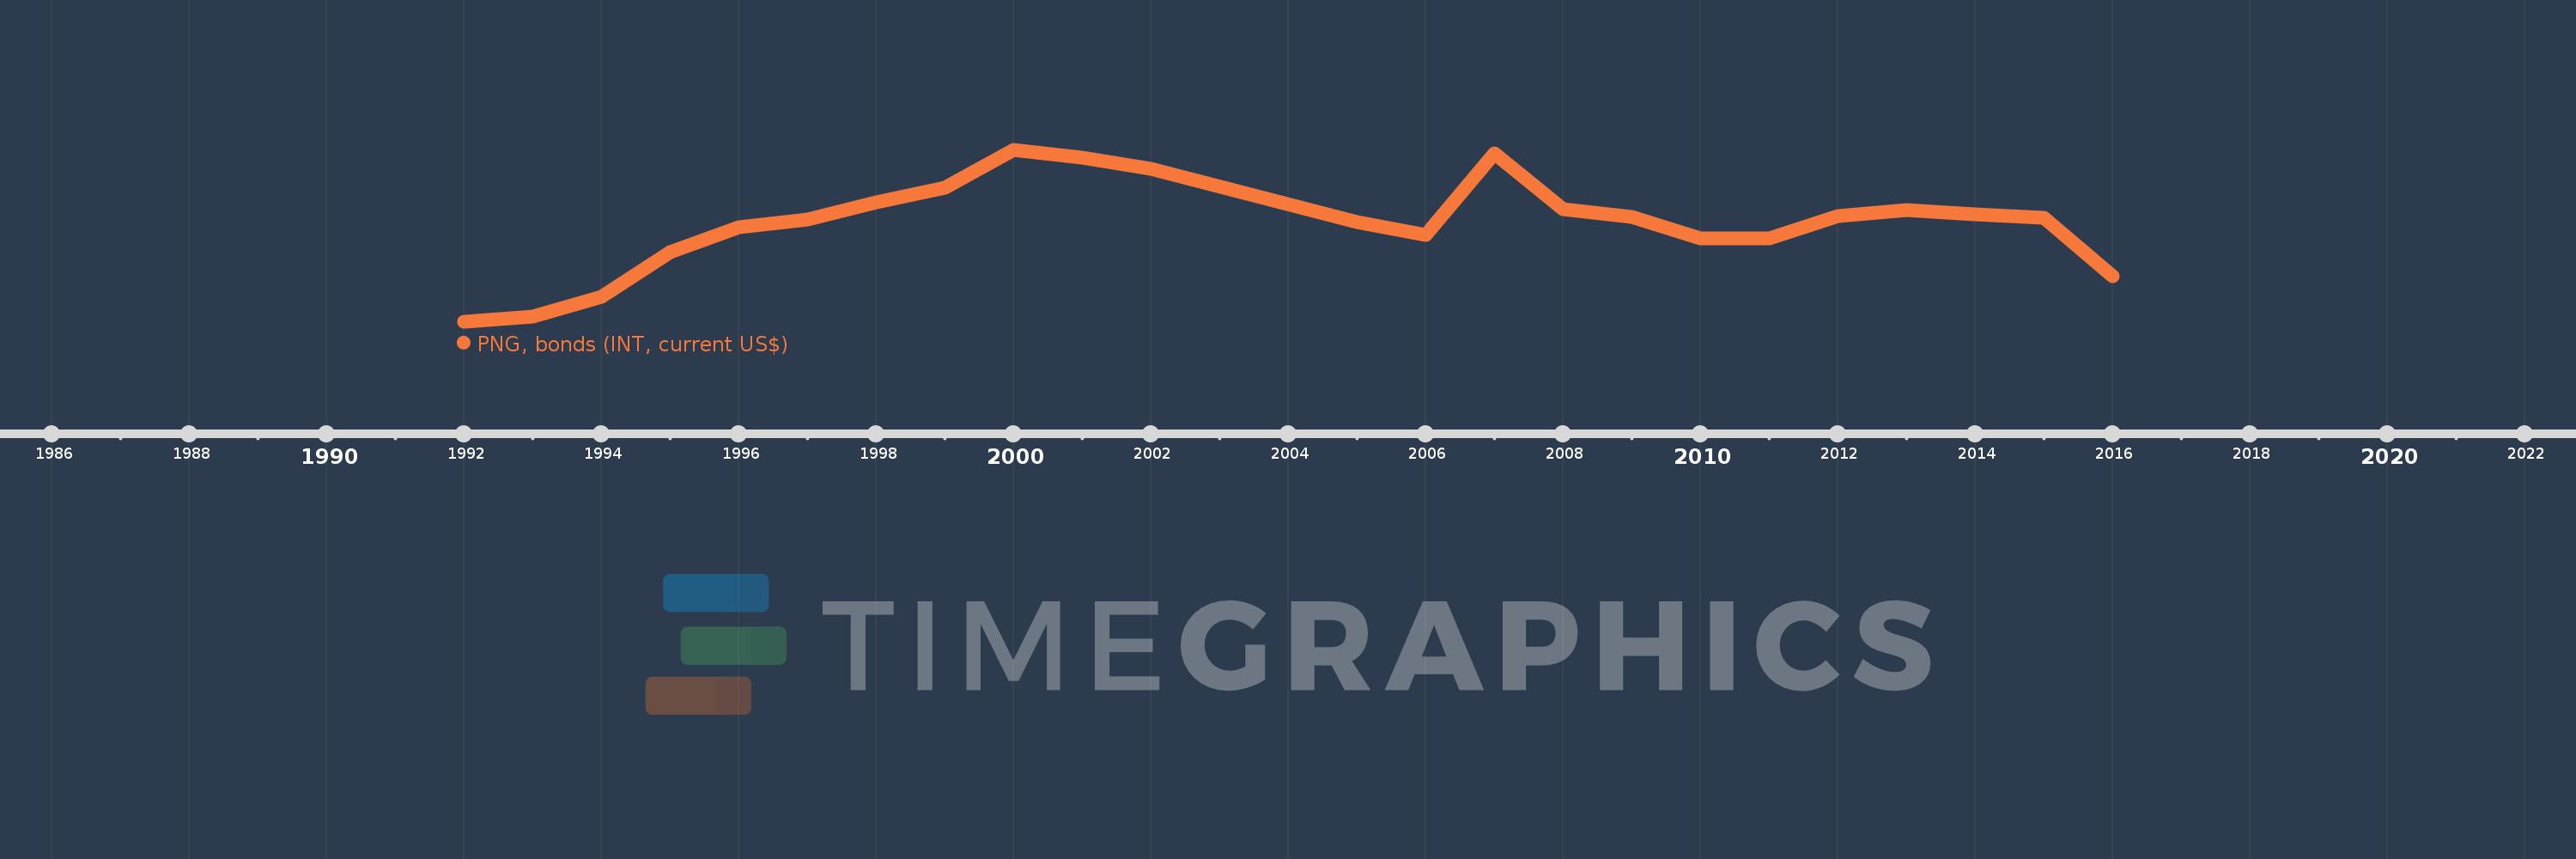
Timeline:
This timeline shows a graph from
1992
to
2016
of Argentina. No data until
1991
. Number of actual observations by date:
23
.
Source name:
World Development Indicators
Source organization:
World Bank, International Debt Statistics.
Categories, topics:
External Debt
Last updated:
apr 23, 2017
Indicators value changes by year
Meaning:
662.231 mln
Minimum:
2.31 mln
jan 1, 1992
Maximum:
1.157 bln
jan 1, 2000
At the date of observation
Value
Absolute change
Change from the previous value
jan 1, 1992
2.31 mln
+2.31 mln
0.0%
jan 1, 1993
37.532 mln
+35.222 mln
1.52K%
jan 1, 1994
171.536 mln
+134.004 mln
357.04%
jan 1, 1995
468.709 mln
+297.173 mln
173.24%
jan 1, 1996
640.751 mln
+172.042 mln
36.71%
jan 1, 1997
691.434 mln
+50.683 mln
7.91%
jan 1, 1998
805.958 mln
+114.524 mln
16.56%
jan 1, 1999
906.775 mln
+100.817 mln
12.51%
jan 1, 2000
1.157 bln
+249.739 mln
27.54%
jan 1, 2001
1.109 bln
-47.903 mln
-4.14%
jan 1, 2002
1.033 bln
-75.332 mln
-6.8%
jan 1, 2005
675.484 mln
-357.795 mln
-34.63%
jan 1, 2006
585.283 mln
-90.201 mln
-13.35%
jan 1, 2007
1.135 bln
+549.309 mln
93.85%
jan 1, 2008
758.573 mln
-376.019 mln
-33.14%
jan 1, 2009
710.282 mln
-48.291 mln
-6.37%
jan 1, 2010
562.133 mln
-148.149 mln
-20.86%
jan 1, 2011
566.584 mln
+4.451 mln
0.79%
jan 1, 2012
716.755 mln
+150.171 mln
26.5%
jan 1, 2013
756.803 mln
+40.048 mln
5.59%
jan 1, 2014
724.886 mln
-31.917 mln
-4.22%
jan 1, 2015
704.619 mln
-20.267 mln
-2.8%
jan 1, 2016
311.912 mln
-392.707 mln
-55.73%
Ranking of countries by current statistics by years
About & Feedback
Terms
Privacy
FAQ
Support 24/7
Cabinet
Get premium
Donate
The service accepts bank transfer (ACH, Wire) or cards (Visa, MasterCard, etc). Processed by Stripe.
Secured with SSL