33
/
AIzaSyB4mHJ5NPEv-XzF7P6NDYXjlkCWaeKw5bc
November 30, 2025
216927
Pakistan
PAK
true
2
1
PNG, bonds (INT, current US$)
2016,2015,2014,2013,2012,2011,2010,2009,2008,2007,2006,2002,2001,2000,1999,1998,1997,1996,1995
Create a timeline
Public Timelines
For education
For educational institutions
For teachers
For students
Cabinet
For educational institutions
For teachers
For students
Open cabinet
FAQ
Close
Create a timeline
Public timelines
FAQ
About & Feedback
Terms
Privacy
FAQ
Support 24/7
Cabinet
Get premium
Donate
Download
Global statistics library
→
Pakistan
→
PNG, bonds (INT, current US$)
This statistics in other country:
Argentina
Botswana
Brazil
Bulgaria
China
Colombia
Costa Rica
Dominican Republic
East Asia & Pacific (excluding high income)
Ecuador
Egypt, Arab Rep.
El Salvador
Europe & Central Asia (excluding high income)
Georgia
Ghana
Guatemala
IDA only
India
Indonesia
Jamaica
Kazakhstan
Lao PDR
Latin America & Caribbean (excluding high income)
Lebanon
Low & middle income
Lower middle income
Malaysia
Mexico
Middle East & North Africa (excluding high income)
Middle income
Mongolia
Nigeria
Pakistan
Panama
Paraguay
Peru
Philippines
Romania
Russian Federation
Serbia
South Africa
South Asia
Sri Lanka
Sub-Saharan Africa (excluding high income)
Thailand
Turkey
Ukraine
Upper middle income
Venezuela, RB
Vietnam
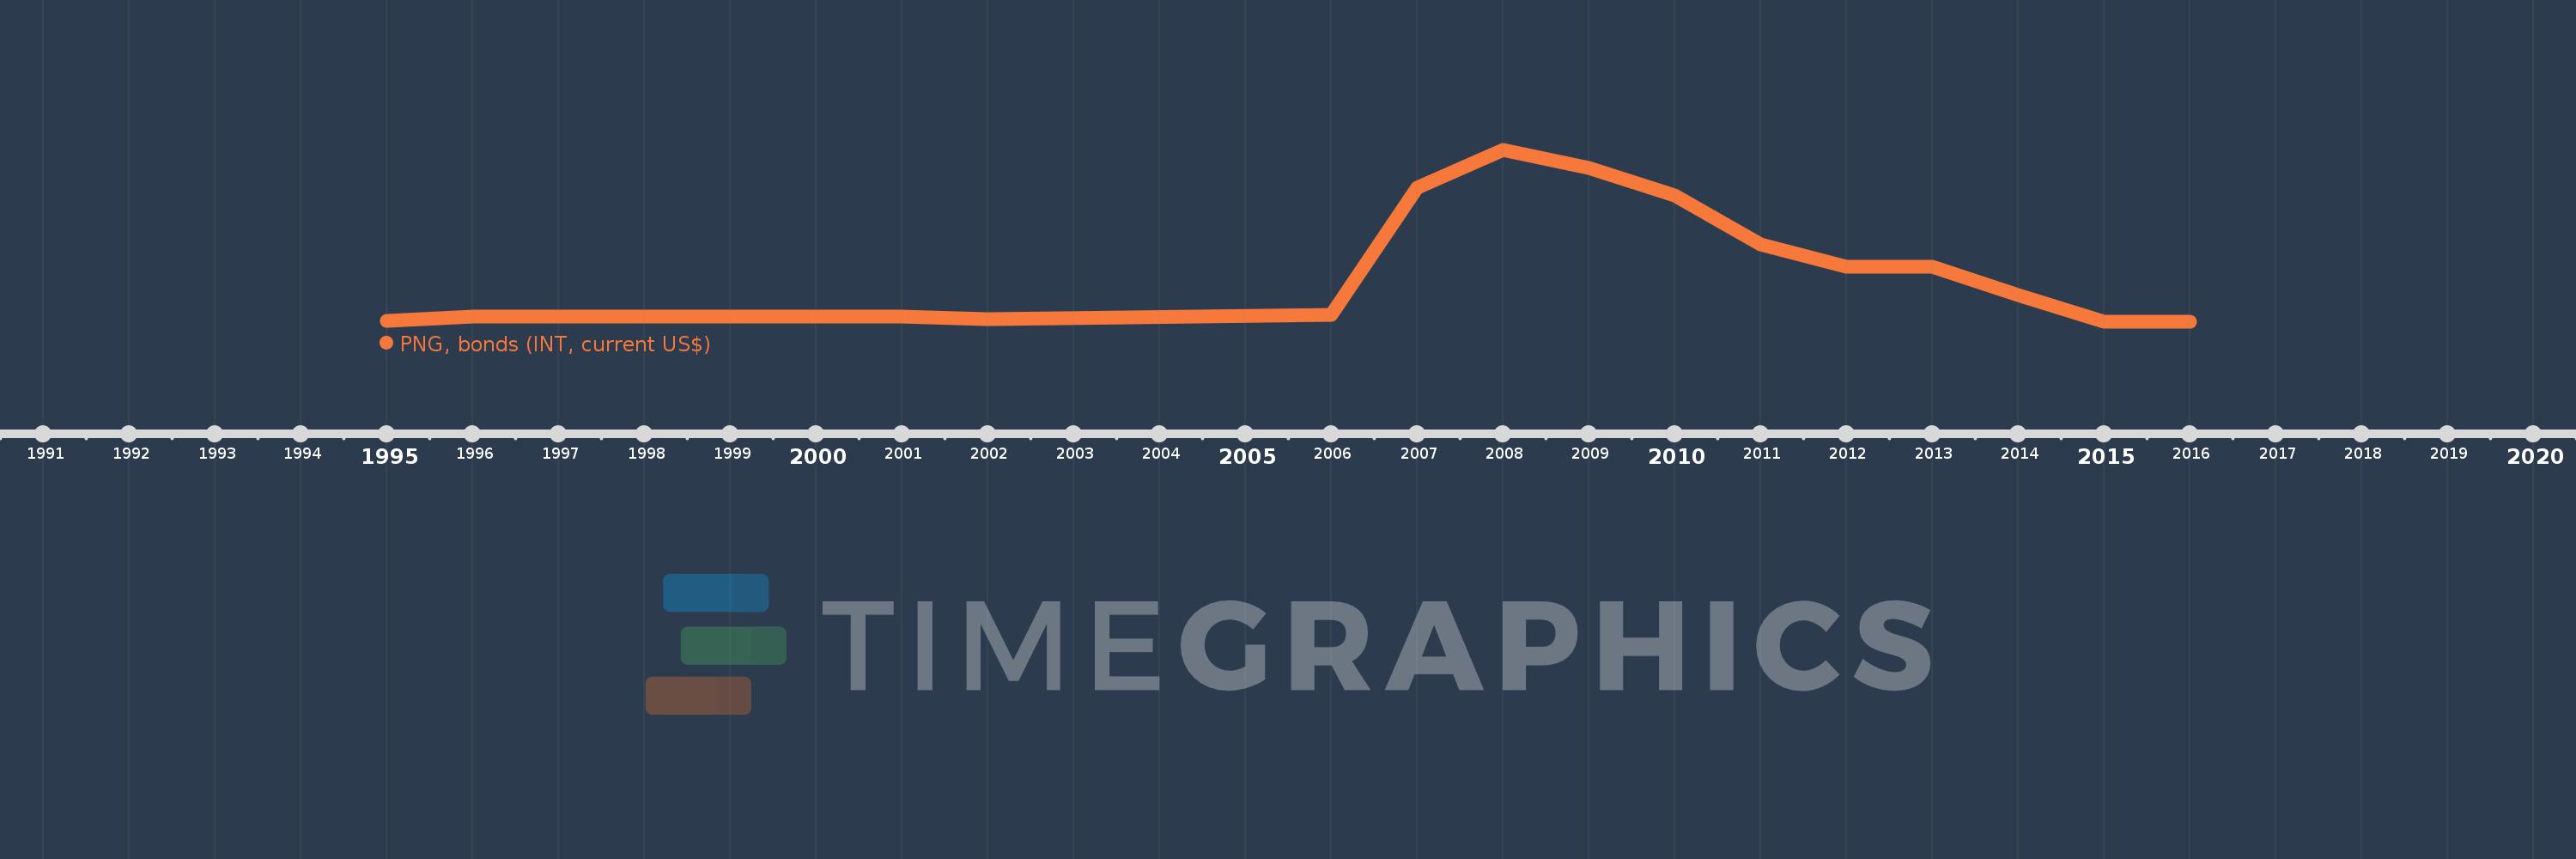
Timeline:
This timeline shows a graph from
1995
to
2016
of Pakistan. No data until
1994
. Number of actual observations by date:
19
.
Source name:
World Development Indicators
Source organization:
World Bank, International Debt Statistics.
Categories, topics:
External Debt
Last updated:
apr 23, 2017
Indicators value changes by year
Meaning:
17.47 mln
Minimum:
160.0K
jan 1, 2015
Maximum:
67.046 mln
jan 1, 2008
At the date of observation
Value
Absolute change
Change from the previous value
jan 1, 1995
675.0K
+675.0K
0.0%
jan 1, 1996
2.25 mln
+1.575 mln
233.33%
jan 1, 1997
2.25 mln
0.0
0.0%
jan 1, 1998
2.25 mln
0.0
0.0%
jan 1, 1999
2.25 mln
0.0
0.0%
jan 1, 2000
2.25 mln
0.0
0.0%
jan 1, 2001
2.25 mln
0.0
0.0%
jan 1, 2002
1.125 mln
-1.125 mln
-50.0%
jan 1, 2006
2.955 mln
+1.83 mln
162.67%
jan 1, 2007
52.27 mln
+49.315 mln
1.67K%
jan 1, 2008
67.046 mln
+14.776 mln
28.27%
jan 1, 2009
60.161 mln
-6.885 mln
-10.27%
jan 1, 2010
49.523 mln
-10.638 mln
-17.68%
jan 1, 2011
30.427 mln
-19.096 mln
-38.56%
jan 1, 2012
21.562 mln
-8.865 mln
-29.14%
jan 1, 2013
21.562 mln
0.0
0.0%
jan 1, 2014
10.781 mln
-10.781 mln
-50.0%
jan 1, 2015
160.0K
-10.621 mln
-98.52%
jan 1, 2016
180.0K
+20.0K
12.5%
Ranking of countries by current statistics by years
About & Feedback
Terms
Privacy
FAQ
Support 24/7
Cabinet
Get premium
Donate
The service accepts bank transfer (ACH, Wire) or cards (Visa, MasterCard, etc). Processed by Stripe.
Secured with SSL