Download This statistics in other country:
Timeline:
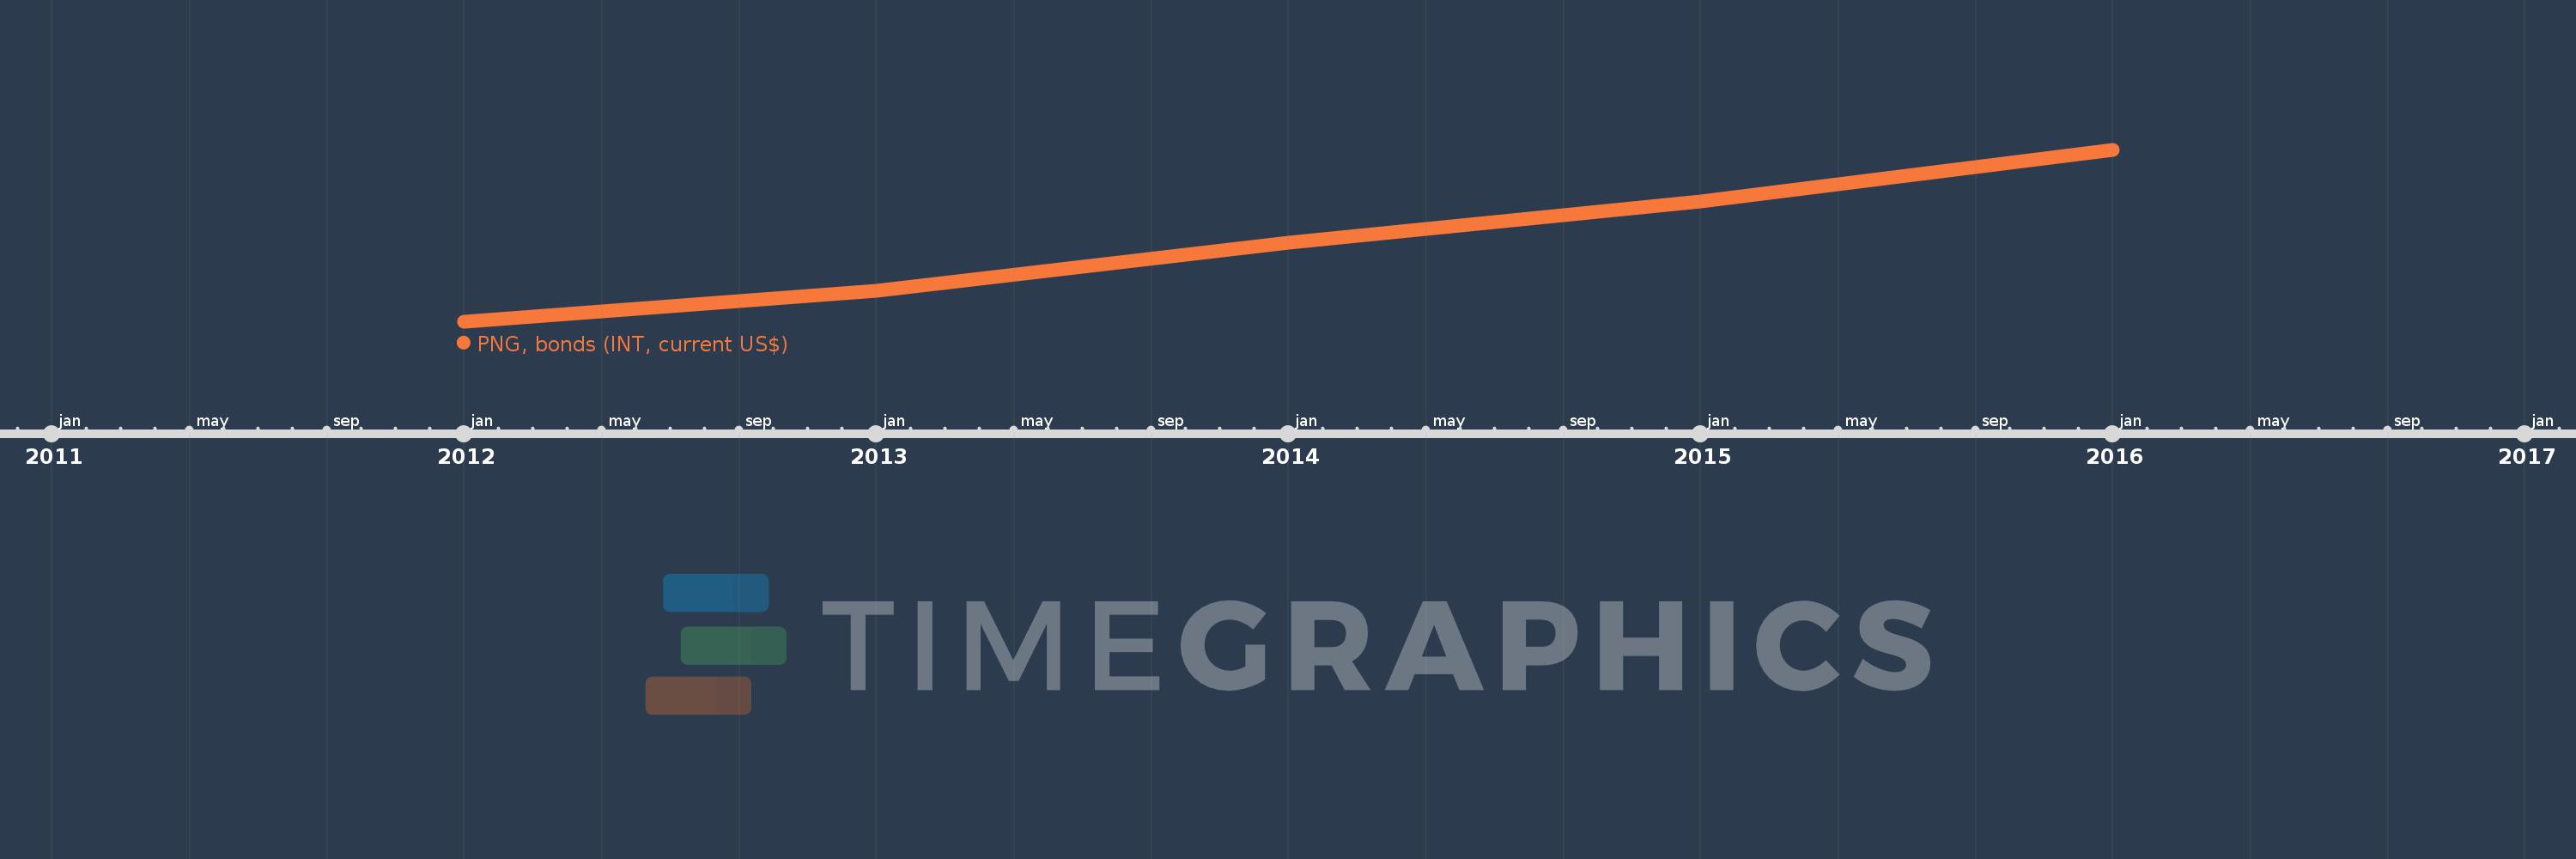
This timeline shows a graph from 2012 to 2016 of Nigeria. No data until 2011. Number of actual observations by date: 5.
Source name:
World Development Indicators
Source organization:
World Bank, International Debt Statistics.
Categories, topics:
External Debt
Last updated:
apr 23, 2017
Indicators value changes by year
Minimum:
18.75 mln
jan 1, 2012
Maximum:
192.904 mln
jan 1, 2016
At the date of observation
Value
Absolute change
Change from the previous value
jan 1, 2012
18.75 mln
+18.75 mln
0.0%
jan 1, 2013
50.188 mln
+31.438 mln
167.67%
jan 1, 2014
99.062 mln
+48.874 mln
97.38%
jan 1, 2015
140.749 mln
+41.687 mln
42.08%
jan 1, 2016
192.904 mln
+52.155 mln
37.06%
Ranking of countries by current statistics by years