33
/
AIzaSyB4mHJ5NPEv-XzF7P6NDYXjlkCWaeKw5bc
November 30, 2025
106427
China
CHN
true
2
1
PNG, bonds (INT, current US$)
2016,2015,2014,2013,2012,2011,2010,2009,2008,2007,2006,2005,2004,2003,2002,2001,2000,1999,1998,1997,1996,1995,1994
Create a timeline
Public Timelines
For education
For educational institutions
For teachers
For students
Cabinet
For educational institutions
For teachers
For students
Open cabinet
FAQ
Close
Create a timeline
Public timelines
FAQ
About & Feedback
Terms
Privacy
FAQ
Support 24/7
Cabinet
Get premium
Donate
Download
Global statistics library
→
China
→
PNG, bonds (INT, current US$)
This statistics in other country:
Argentina
Botswana
Brazil
Bulgaria
China
Colombia
Costa Rica
Dominican Republic
East Asia & Pacific (excluding high income)
Ecuador
Egypt, Arab Rep.
El Salvador
Europe & Central Asia (excluding high income)
Georgia
Ghana
Guatemala
IDA only
India
Indonesia
Jamaica
Kazakhstan
Lao PDR
Latin America & Caribbean (excluding high income)
Lebanon
Low & middle income
Lower middle income
Malaysia
Mexico
Middle East & North Africa (excluding high income)
Middle income
Mongolia
Nigeria
Pakistan
Panama
Paraguay
Peru
Philippines
Romania
Russian Federation
Serbia
South Africa
South Asia
Sri Lanka
Sub-Saharan Africa (excluding high income)
Thailand
Turkey
Ukraine
Upper middle income
Venezuela, RB
Vietnam
Timeline:
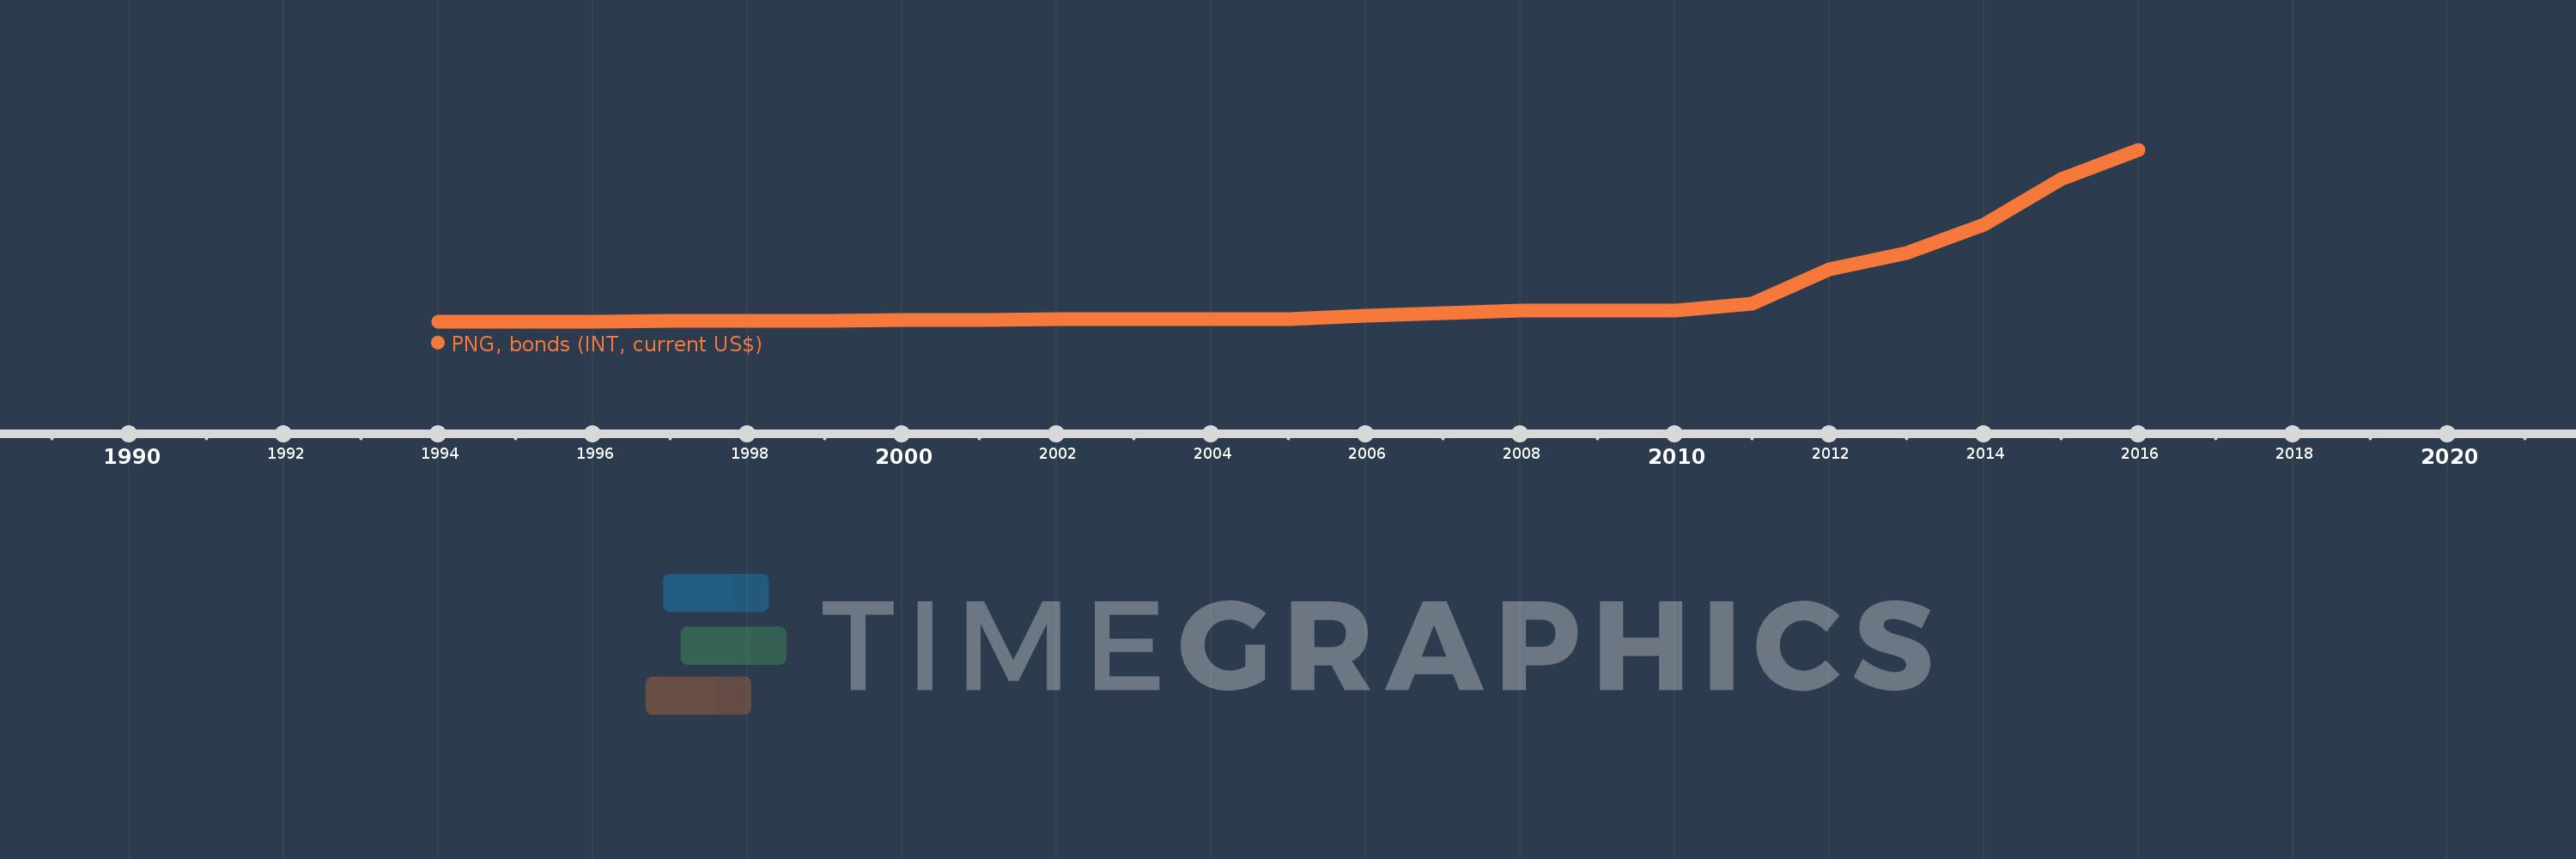
This timeline shows a graph from
1994
to
2016
of China. No data until
1993
. Number of actual observations by date:
23
.
Source name:
World Development Indicators
Source organization:
World Bank, International Debt Statistics.
Categories, topics:
External Debt
Last updated:
apr 23, 2017
Indicators value changes by year
Meaning:
1.009 bln
Minimum:
11.719 mln
jan 1, 1994
Maximum:
6.352 bln
jan 1, 2016
At the date of observation
Value
Absolute change
Change from the previous value
jan 1, 1994
11.719 mln
+11.719 mln
0.0%
jan 1, 1995
26.213 mln
+14.494 mln
123.68%
jan 1, 1996
33.247 mln
+7.034 mln
26.83%
jan 1, 1997
53.231 mln
+19.984 mln
60.11%
jan 1, 1998
55.37 mln
+2.139 mln
4.02%
jan 1, 1999
41.592 mln
-13.778 mln
-24.88%
jan 1, 2000
95.662 mln
+54.07 mln
130.0%
jan 1, 2001
93.42 mln
-2.242 mln
-2.34%
jan 1, 2002
110.559 mln
+17.139 mln
18.35%
jan 1, 2003
118.816 mln
+8.257 mln
7.47%
jan 1, 2004
123.424 mln
+4.608 mln
3.88%
jan 1, 2005
122.35 mln
-1.074 mln
-0.87%
jan 1, 2006
247.758 mln
+125.408 mln
102.5%
jan 1, 2007
343.018 mln
+95.26 mln
38.45%
jan 1, 2008
444.645 mln
+101.627 mln
29.63%
jan 1, 2009
431.401 mln
-13.244 mln
-2.98%
jan 1, 2010
444.979 mln
+13.578 mln
3.15%
jan 1, 2011
672.416 mln
+227.437 mln
51.11%
jan 1, 2012
1.942 bln
+1.27 bln
188.86%
jan 1, 2013
2.558 bln
+615.45 mln
31.69%
jan 1, 2014
3.593 bln
+1.036 bln
40.49%
jan 1, 2015
5.299 bln
+1.706 bln
47.47%
jan 1, 2016
6.352 bln
+1.053 bln
19.87%
Ranking of countries by current statistics by years
About & Feedback
Terms
Privacy
FAQ
Support 24/7
Cabinet
Get premium
Donate
The service accepts bank transfer (ACH, Wire) or cards (Visa, MasterCard, etc). Processed by Stripe.
Secured with SSL