33
/
AIzaSyB4mHJ5NPEv-XzF7P6NDYXjlkCWaeKw5bc
November 30, 2025
230226
Russian Federation
RUS
true
2
1
PNG, bonds (INT, current US$)
2016,2015,2014,2013,2012,2010,2009,2008,2007,2006,2005,2004,2003,2002,2001,2000,1999
Create a timeline
Public Timelines
For education
For educational institutions
For teachers
For students
Cabinet
For educational institutions
For teachers
For students
Open cabinet
FAQ
Close
Create a timeline
Public timelines
FAQ
About & Feedback
Terms
Privacy
FAQ
Support 24/7
Cabinet
Get premium
Donate
Download
Global statistics library
→
Russian Federation
→
PNG, bonds (INT, current US$)
This statistics in other country:
Argentina
Botswana
Brazil
Bulgaria
China
Colombia
Costa Rica
Dominican Republic
East Asia & Pacific (excluding high income)
Ecuador
Egypt, Arab Rep.
El Salvador
Europe & Central Asia (excluding high income)
Georgia
Ghana
Guatemala
IDA only
India
Indonesia
Jamaica
Kazakhstan
Lao PDR
Latin America & Caribbean (excluding high income)
Lebanon
Low & middle income
Lower middle income
Malaysia
Mexico
Middle East & North Africa (excluding high income)
Middle income
Mongolia
Nigeria
Pakistan
Panama
Paraguay
Peru
Philippines
Romania
Russian Federation
Serbia
South Africa
South Asia
Sri Lanka
Sub-Saharan Africa (excluding high income)
Thailand
Turkey
Ukraine
Upper middle income
Venezuela, RB
Vietnam
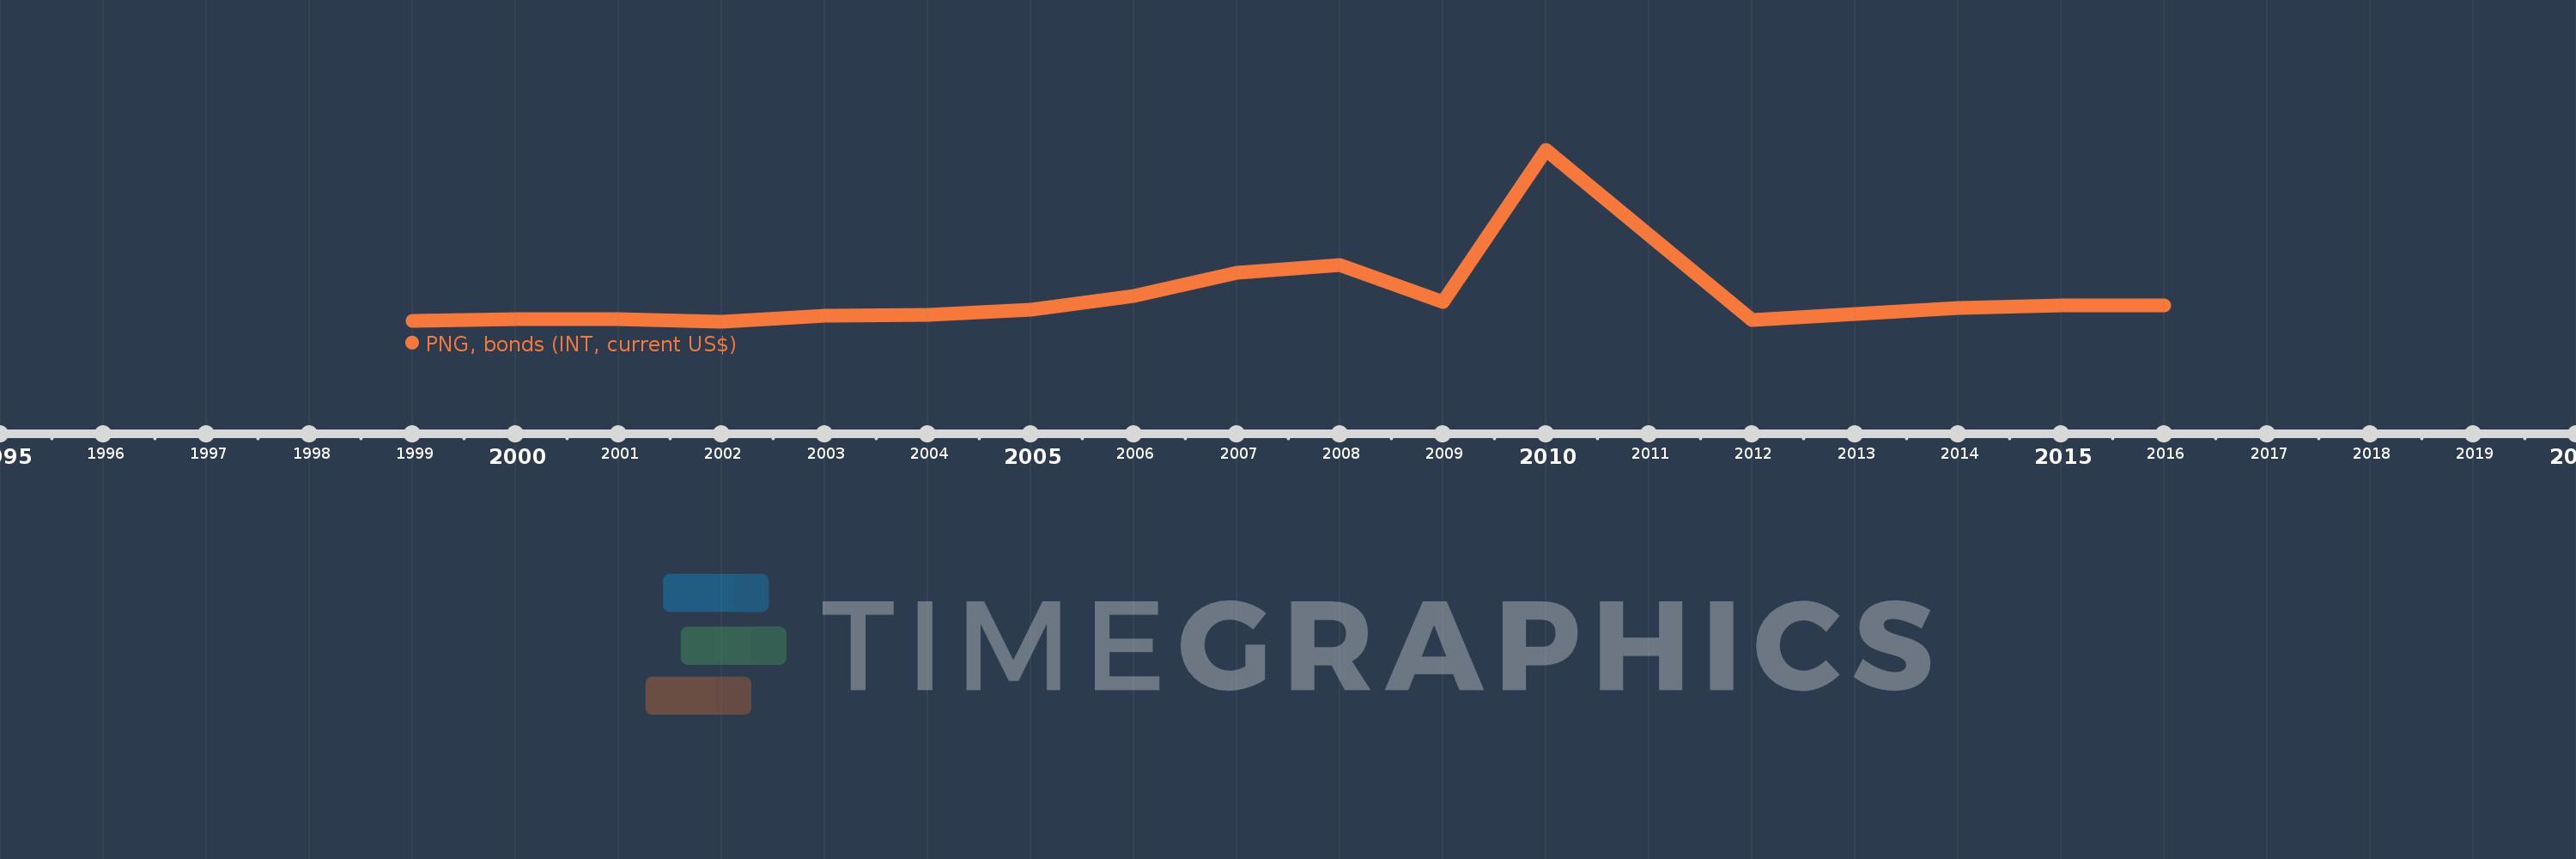
Timeline:
This timeline shows a graph from
1999
to
2016
of Russian Federation. No data until
1998
. Number of actual observations by date:
17
.
Source name:
World Development Indicators
Source organization:
World Bank, International Debt Statistics.
Categories, topics:
External Debt
Last updated:
apr 23, 2017
Indicators value changes by year
Meaning:
854.854 mln
Minimum:
80.236 mln
jan 1, 2002
Maximum:
5.55 bln
jan 1, 2010
At the date of observation
Value
Absolute change
Change from the previous value
jan 1, 1999
129.075 mln
+129.075 mln
0.0%
jan 1, 2000
170.083 mln
+41.008 mln
31.77%
jan 1, 2001
165.348 mln
-4.735 mln
-2.78%
jan 1, 2002
80.236 mln
-85.112 mln
-51.47%
jan 1, 2003
280.944 mln
+200.708 mln
250.15%
jan 1, 2004
312.711 mln
+31.767 mln
11.31%
jan 1, 2005
458.654 mln
+145.943 mln
46.67%
jan 1, 2006
906.943 mln
+448.289 mln
97.74%
jan 1, 2007
1.647 bln
+739.561 mln
81.54%
jan 1, 2008
1.902 bln
+255.14 mln
15.5%
jan 1, 2009
722.422 mln
-1.179 bln
-62.01%
jan 1, 2010
5.55 bln
+4.828 bln
668.29%
jan 1, 2012
137.364 mln
-5.413 bln
-97.53%
jan 1, 2013
331.132 mln
+193.768 mln
141.06%
jan 1, 2014
526.612 mln
+195.48 mln
59.03%
jan 1, 2015
596.815 mln
+70.203 mln
13.33%
jan 1, 2016
615.739 mln
+18.924 mln
3.17%
Ranking of countries by current statistics by years
About & Feedback
Terms
Privacy
FAQ
Support 24/7
Cabinet
Get premium
Donate
The service accepts bank transfer (ACH, Wire) or cards (Visa, MasterCard, etc). Processed by Stripe.
Secured with SSL