33
/
AIzaSyB4mHJ5NPEv-XzF7P6NDYXjlkCWaeKw5bc
November 30, 2025
155101
India
IND
true
2
1
PNG, bonds (INT, current US$)
2016,2015,2014,2013,2012,2011,2010,2009,2008,2007,2006,2005,2004,2003,2002,2001,2000,1999,1998,1997,1996,1995,1994
Create a timeline
Public Timelines
For education
For educational institutions
For teachers
For students
Cabinet
For educational institutions
For teachers
For students
Open cabinet
FAQ
Close
Create a timeline
Public timelines
FAQ
About & Feedback
Terms
Privacy
FAQ
Support 24/7
Cabinet
Get premium
Donate
Download
Global statistics library
→
India
→
PNG, bonds (INT, current US$)
This statistics in other country:
Argentina
Botswana
Brazil
Bulgaria
China
Colombia
Costa Rica
Dominican Republic
East Asia & Pacific (excluding high income)
Ecuador
Egypt, Arab Rep.
El Salvador
Europe & Central Asia (excluding high income)
Georgia
Ghana
Guatemala
IDA only
India
Indonesia
Jamaica
Kazakhstan
Lao PDR
Latin America & Caribbean (excluding high income)
Lebanon
Low & middle income
Lower middle income
Malaysia
Mexico
Middle East & North Africa (excluding high income)
Middle income
Mongolia
Nigeria
Pakistan
Panama
Paraguay
Peru
Philippines
Romania
Russian Federation
Serbia
South Africa
South Asia
Sri Lanka
Sub-Saharan Africa (excluding high income)
Thailand
Turkey
Ukraine
Upper middle income
Venezuela, RB
Vietnam
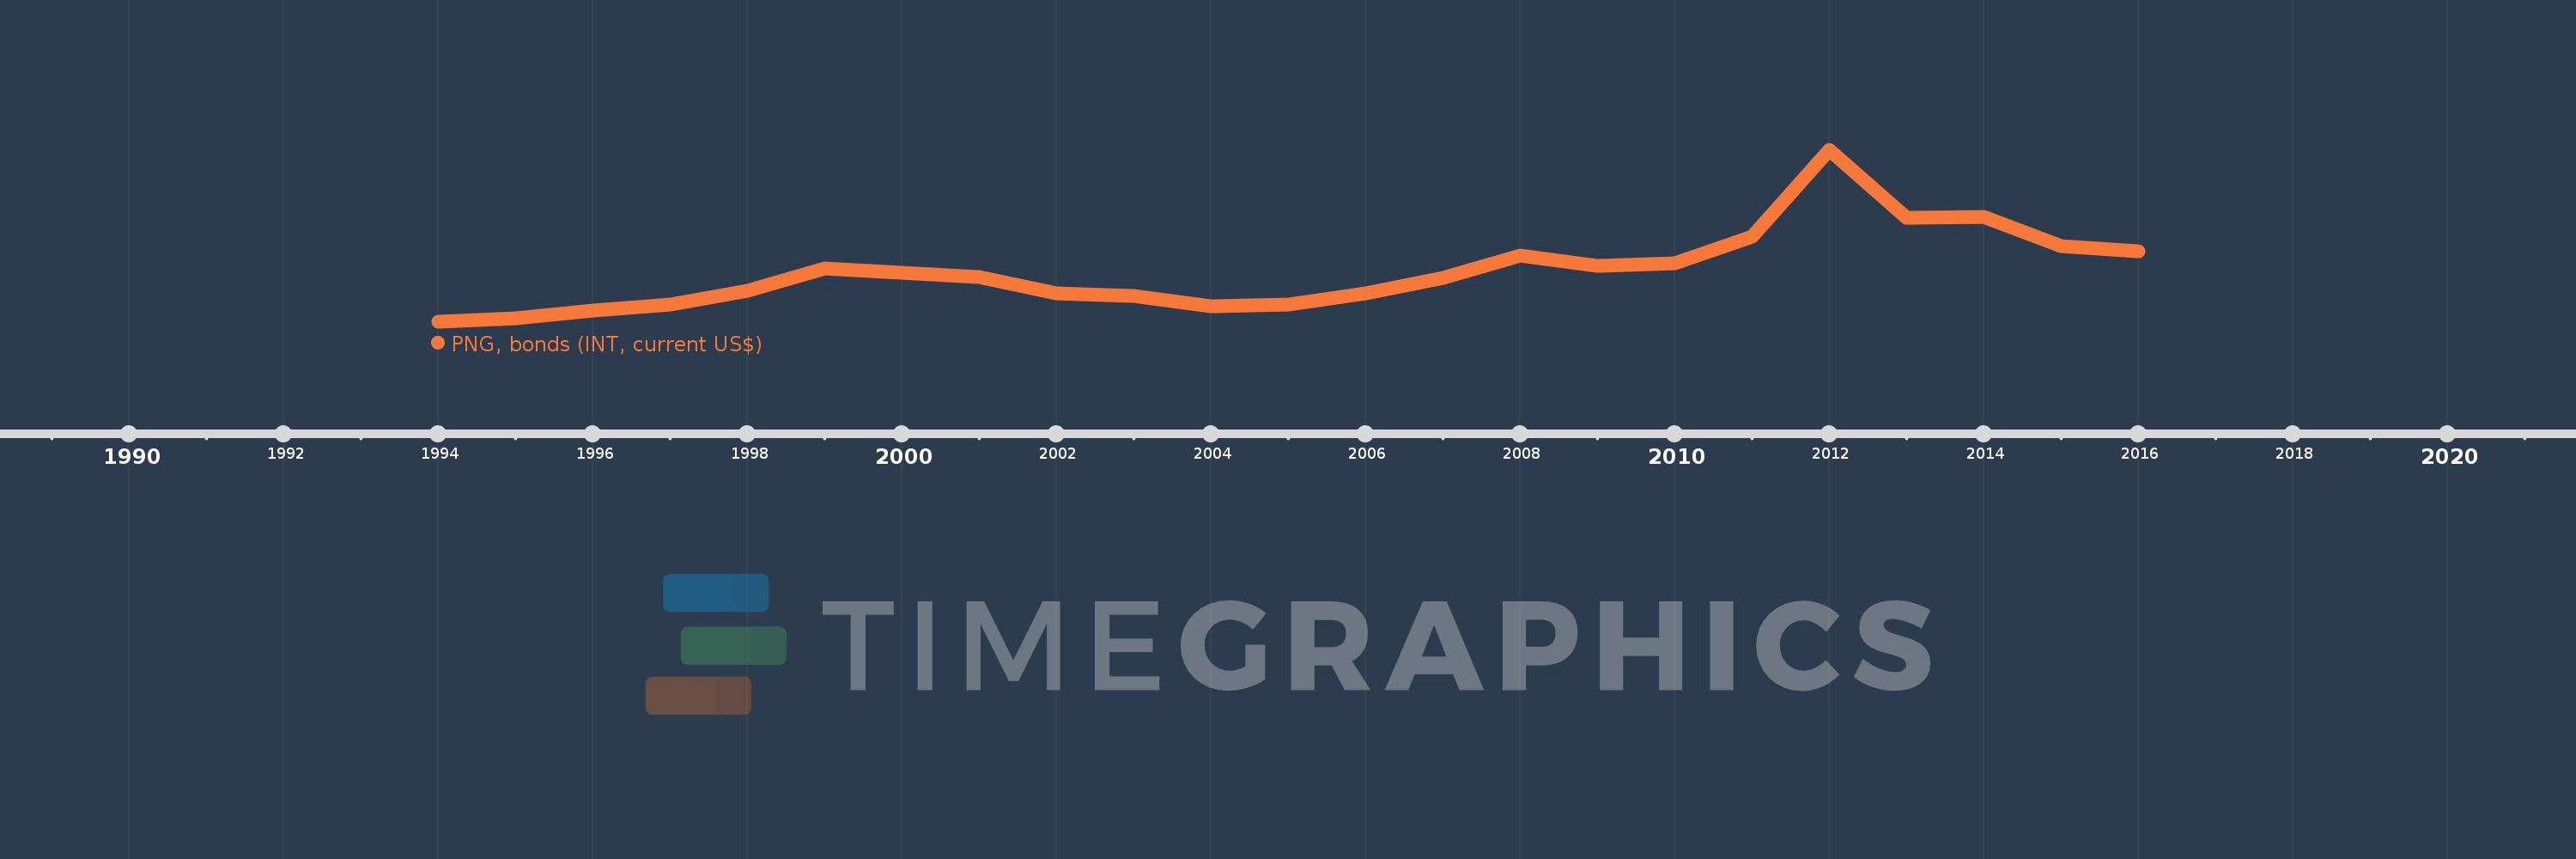
Timeline:
This timeline shows a graph from
1994
to
2016
of India. No data until
1993
. Number of actual observations by date:
23
.
Source name:
World Development Indicators
Source organization:
World Bank, International Debt Statistics.
Categories, topics:
External Debt
Last updated:
apr 23, 2017
Indicators value changes by year
Meaning:
250.714 mln
Minimum:
771.0K
jan 1, 1994
Maximum:
848.358 mln
jan 1, 2012
At the date of observation
Value
Absolute change
Change from the previous value
jan 1, 1994
771.0K
+771.0K
0.0%
jan 1, 1995
20.136 mln
+19.365 mln
2.51K%
jan 1, 1996
56.126 mln
+35.99 mln
178.73%
jan 1, 1997
88.341 mln
+32.215 mln
57.4%
jan 1, 1998
154.066 mln
+65.725 mln
74.4%
jan 1, 1999
265.155 mln
+111.089 mln
72.1%
jan 1, 2000
242.699 mln
-22.456 mln
-8.47%
jan 1, 2001
224.319 mln
-18.38 mln
-7.57%
jan 1, 2002
143.365 mln
-80.954 mln
-36.09%
jan 1, 2003
127.145 mln
-16.22 mln
-11.31%
jan 1, 2004
77.38 mln
-49.765 mln
-39.14%
jan 1, 2005
85.099 mln
+7.719 mln
9.98%
jan 1, 2006
141.061 mln
+55.962 mln
65.76%
jan 1, 2007
216.664 mln
+75.603 mln
53.6%
jan 1, 2008
329.962 mln
+113.298 mln
52.29%
jan 1, 2009
278.34 mln
-51.622 mln
-15.64%
jan 1, 2010
289.533 mln
+11.193 mln
4.02%
jan 1, 2011
420.502 mln
+130.969 mln
45.23%
jan 1, 2012
848.358 mln
+427.856 mln
101.75%
jan 1, 2013
516.0 mln
-332.358 mln
-39.18%
jan 1, 2014
517.874 mln
+1.874 mln
0.36%
jan 1, 2015
374.618 mln
-143.256 mln
-27.66%
jan 1, 2016
348.919 mln
-25.699 mln
-6.86%
Ranking of countries by current statistics by years
About & Feedback
Terms
Privacy
FAQ
Support 24/7
Cabinet
Get premium
Donate
The service accepts bank transfer (ACH, Wire) or cards (Visa, MasterCard, etc). Processed by Stripe.
Secured with SSL