Download This statistics in other country:
Timeline:
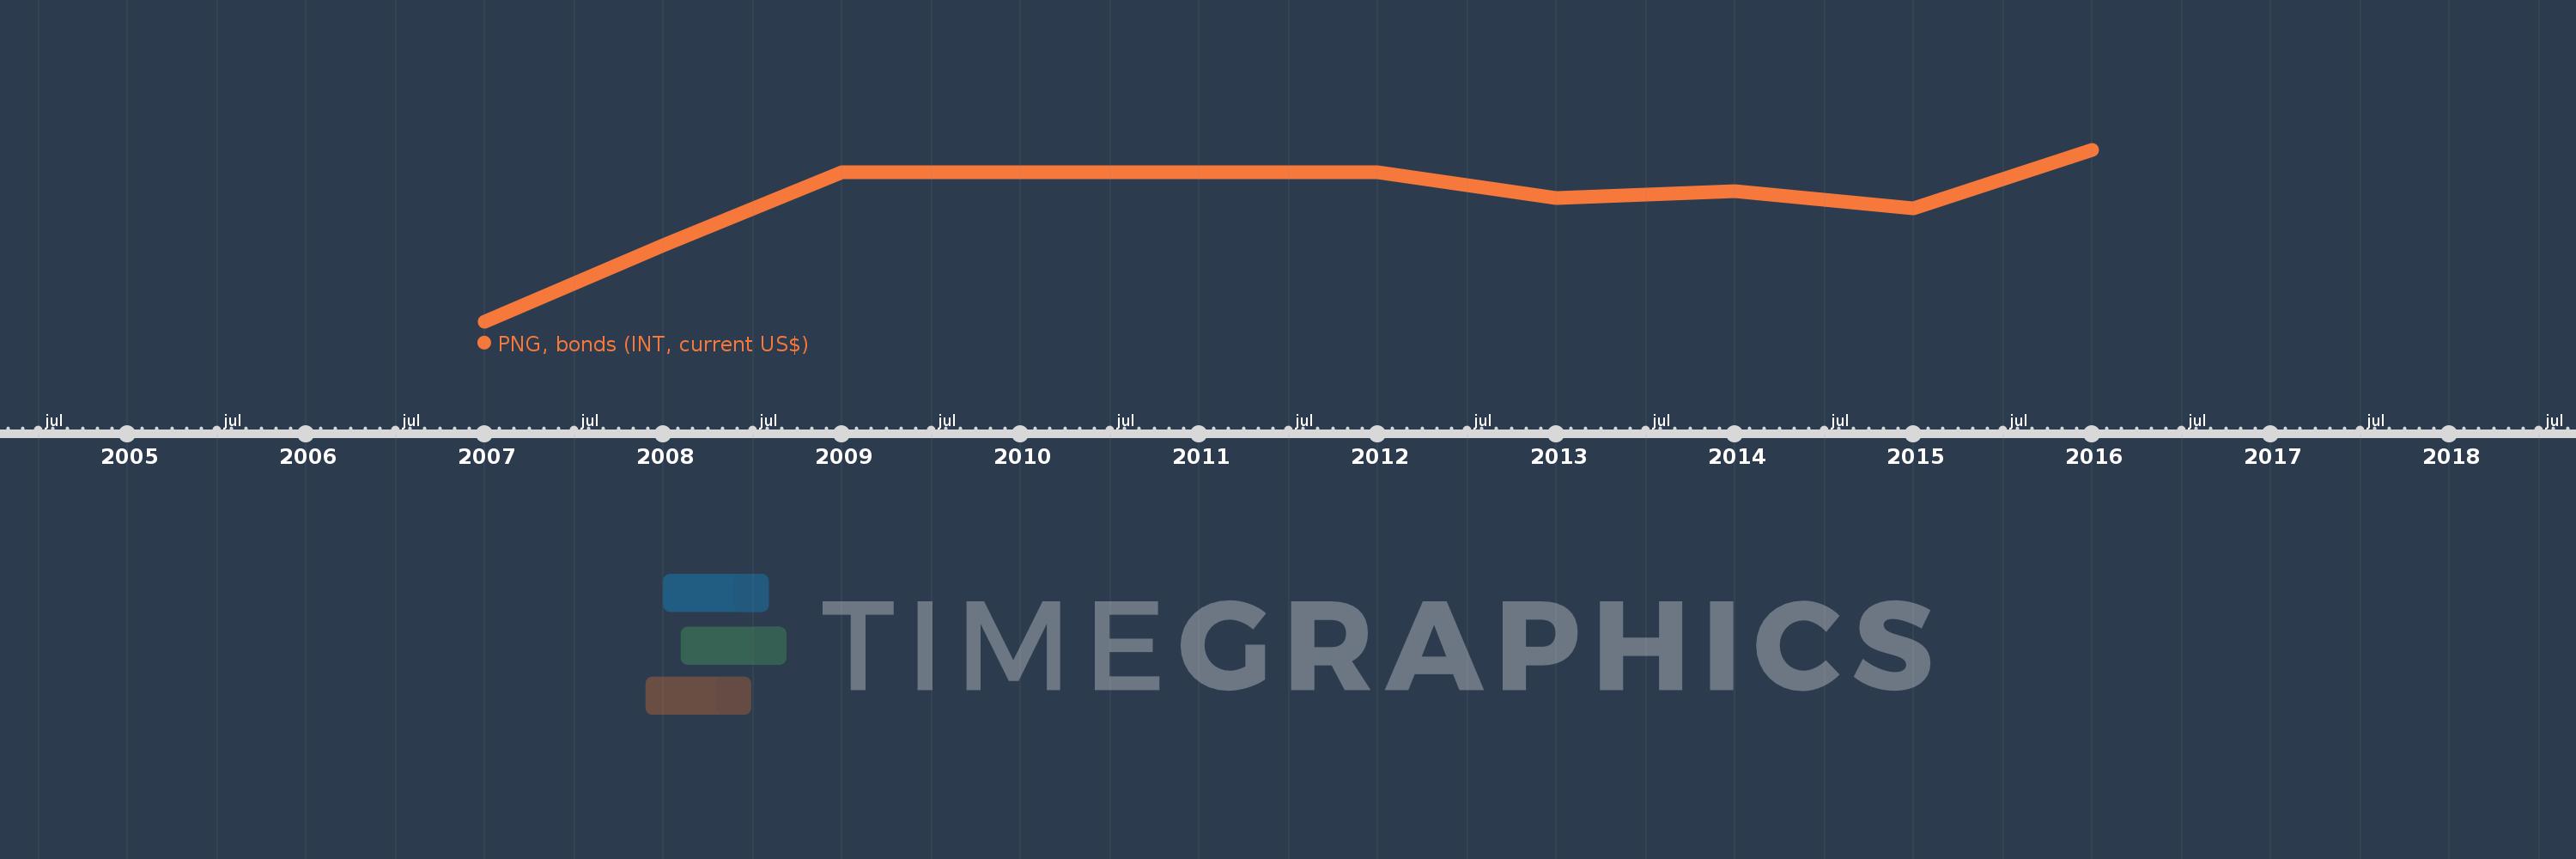
This timeline shows a graph from 2007 to 2016 of Dominican Republic. No data until 2006. Number of actual observations by date: 10.
Source name:
World Development Indicators
Source organization:
World Bank, International Debt Statistics.
Categories, topics:
External Debt
Last updated:
apr 23, 2017
Indicators value changes by year
Minimum:
1.648 mln
jan 1, 2007
Maximum:
124.22 mln
jan 1, 2016
At the date of observation
Value
Absolute change
Change from the previous value
jan 1, 2007
1.648 mln
+1.648 mln
0.0%
jan 1, 2008
56.649 mln
+55.001 mln
3.34K%
jan 1, 2009
108.174 mln
+51.525 mln
90.95%
jan 1, 2010
108.174 mln
0.0
0.0%
jan 1, 2011
108.174 mln
0.0
0.0%
jan 1, 2012
108.174 mln
0.0
0.0%
jan 1, 2013
90.348 mln
-17.826 mln
-16.48%
jan 1, 2014
94.741 mln
+4.393 mln
4.86%
jan 1, 2015
82.71 mln
-12.031 mln
-12.7%
jan 1, 2016
124.22 mln
+41.51 mln
50.19%
Ranking of countries by current statistics by years