33
/
AIzaSyB4mHJ5NPEv-XzF7P6NDYXjlkCWaeKw5bc
November 30, 2025
156491
Indonesia
IDN
true
2
1
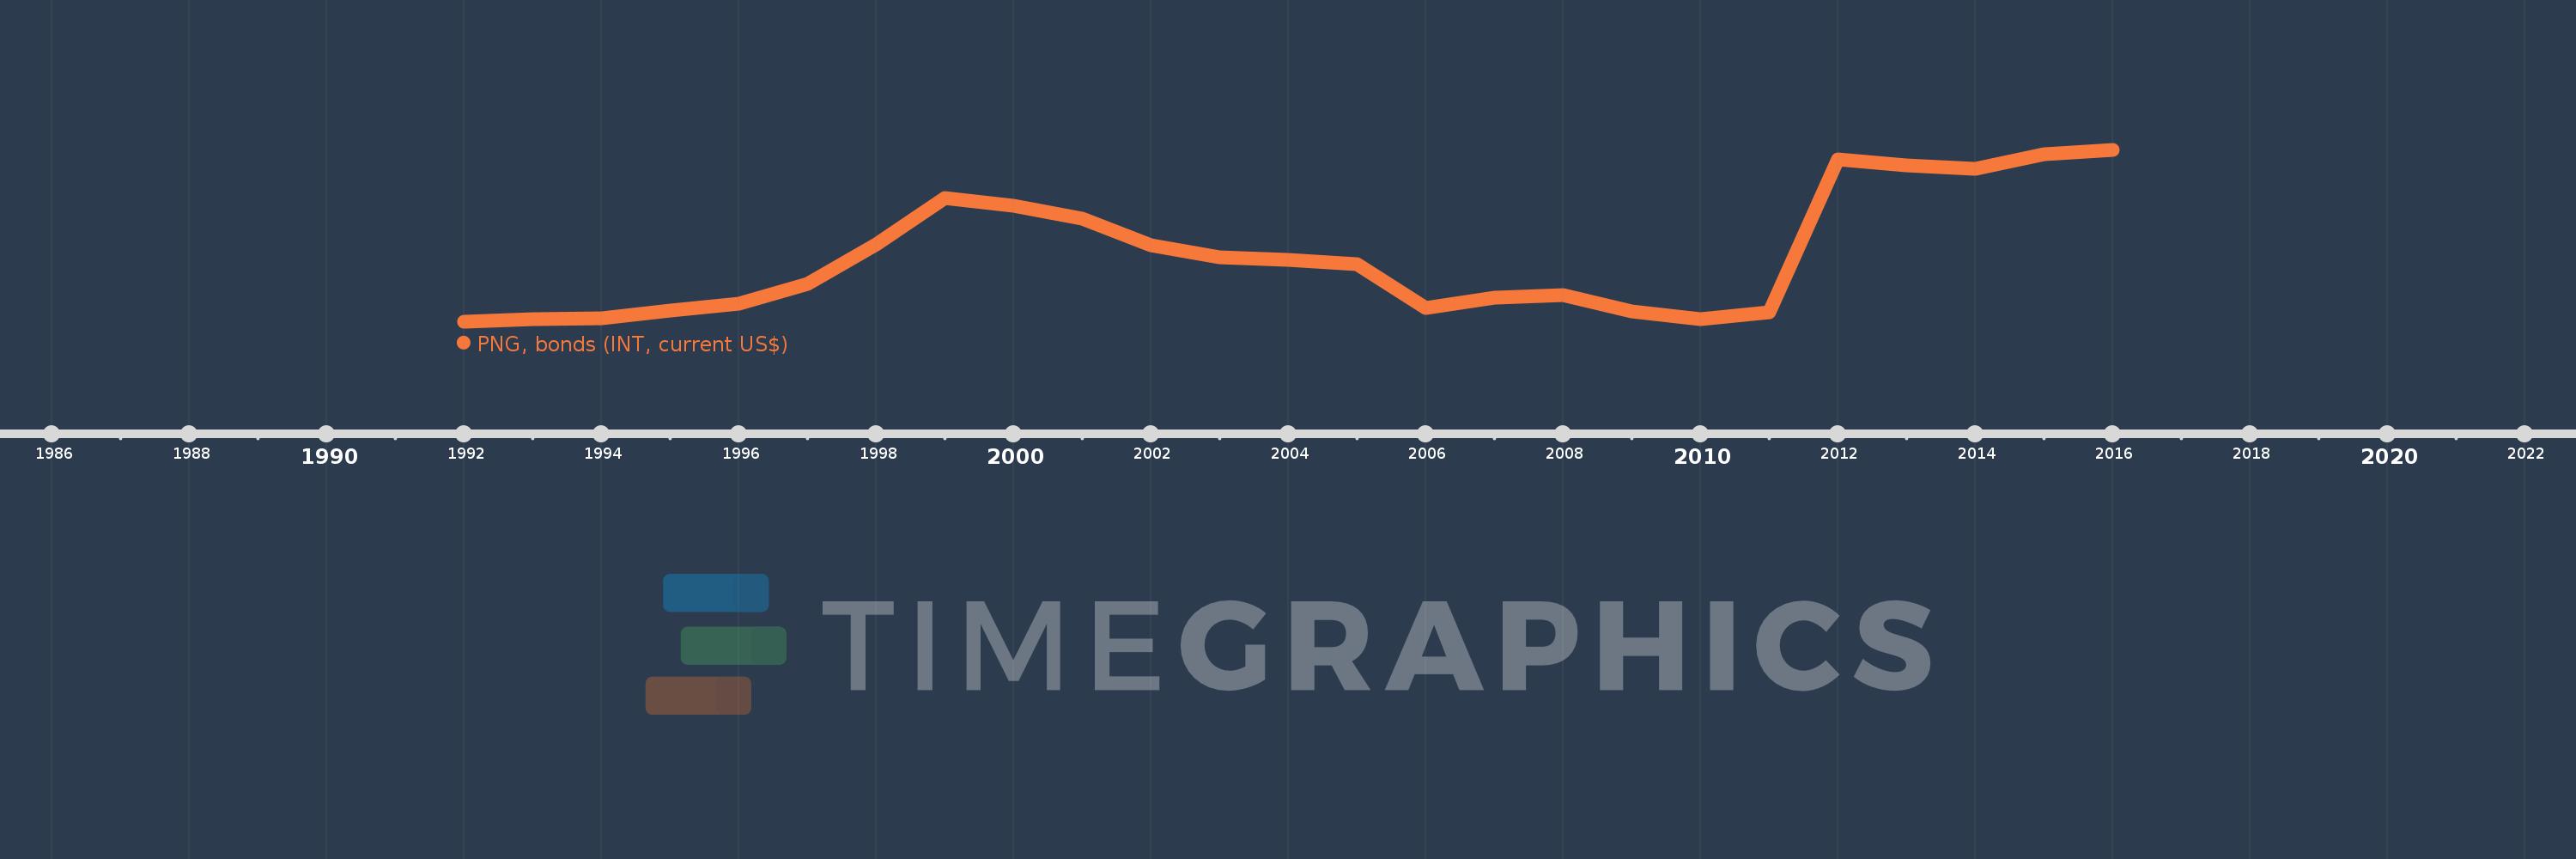
PNG, bonds (INT, current US$)
2016,2015,2014,2013,2012,2011,2010,2009,2008,2007,2006,2005,2004,2003,2002,2001,2000,1999,1998,1997,1996,1995,1994,1993,1992
Create a timeline
Public Timelines
For education
For educational institutions
For teachers
For students
Cabinet
For educational institutions
For teachers
For students
Open cabinet
FAQ
Close
Create a timeline
Public timelines
FAQ
About & Feedback
Terms
Privacy
FAQ
Support 24/7
Cabinet
Get premium
Donate
Download
Global statistics library
→
Indonesia
→
PNG, bonds (INT, current US$)
This statistics in other country:
Argentina
Botswana
Brazil
Bulgaria
China
Colombia
Costa Rica
Dominican Republic
East Asia & Pacific (excluding high income)
Ecuador
Egypt, Arab Rep.
El Salvador
Europe & Central Asia (excluding high income)
Georgia
Ghana
Guatemala
IDA only
India
Indonesia
Jamaica
Kazakhstan
Lao PDR
Latin America & Caribbean (excluding high income)
Lebanon
Low & middle income
Lower middle income
Malaysia
Mexico
Middle East & North Africa (excluding high income)
Middle income
Mongolia
Nigeria
Pakistan
Panama
Paraguay
Peru
Philippines
Romania
Russian Federation
Serbia
South Africa
South Asia
Sri Lanka
Sub-Saharan Africa (excluding high income)
Thailand
Turkey
Ukraine
Upper middle income
Venezuela, RB
Vietnam
Timeline:
This timeline shows a graph from
1992
to
2016
of Indonesia. No data until
1991
. Number of actual observations by date:
25
.
Source name:
World Development Indicators
Source organization:
World Bank, International Debt Statistics.
Categories, topics:
External Debt
Last updated:
apr 23, 2017
Indicators value changes by year
Meaning:
475.044 mln
Minimum:
12.659 mln
jan 1, 1992
Maximum:
1.211 bln
jan 1, 2016
At the date of observation
Value
Absolute change
Change from the previous value
jan 1, 1992
12.659 mln
+12.659 mln
0.0%
jan 1, 1993
32.307 mln
+19.648 mln
155.21%
jan 1, 1994
40.619 mln
+8.312 mln
25.73%
jan 1, 1995
91.138 mln
+50.519 mln
124.37%
jan 1, 1996
138.982 mln
+47.844 mln
52.5%
jan 1, 1997
276.343 mln
+137.361 mln
98.83%
jan 1, 1998
551.368 mln
+275.025 mln
99.52%
jan 1, 1999
877.49 mln
+326.122 mln
59.15%
jan 1, 2000
824.223 mln
-53.267 mln
-6.07%
jan 1, 2001
735.06 mln
-89.163 mln
-10.82%
jan 1, 2002
546.204 mln
-188.856 mln
-25.69%
jan 1, 2003
462.058 mln
-84.146 mln
-15.41%
jan 1, 2004
447.13 mln
-14.928 mln
-3.23%
jan 1, 2005
413.492 mln
-33.638 mln
-7.52%
jan 1, 2006
113.051 mln
-300.441 mln
-72.66%
jan 1, 2007
183.684 mln
+70.633 mln
62.48%
jan 1, 2008
201.757 mln
+18.073 mln
9.84%
jan 1, 2009
88.519 mln
-113.238 mln
-56.13%
jan 1, 2010
30.627 mln
-57.892 mln
-65.4%
jan 1, 2011
81.396 mln
+50.769 mln
165.77%
jan 1, 2012
1.145 bln
+1.064 bln
1.31K%
jan 1, 2013
1.104 bln
-41.593 mln
-3.63%
jan 1, 2014
1.083 bln
-21.015 mln
-1.9%
jan 1, 2015
1.185 bln
+102.261 mln
9.44%
jan 1, 2016
1.211 bln
+25.572 mln
2.16%
Ranking of countries by current statistics by years
About & Feedback
Terms
Privacy
FAQ
Support 24/7
Cabinet
Get premium
Donate
The service accepts bank transfer (ACH, Wire) or cards (Visa, MasterCard, etc). Processed by Stripe.
Secured with SSL