Download This statistics in other country:
AfghanistanAlbaniaAlgeriaAndorraAngolaAntigua and BarbudaArgentinaArmeniaAustraliaAustriaAzerbaijanBahamas, TheBahrainBangladeshBarbadosBelarusBelgiumBelizeBeninBhutanBoliviaBosnia and HerzegovinaBotswanaBrazilBrunei DarussalamBulgariaBurkina FasoBurundiCabo VerdeCambodiaCameroonCanadaCentral African RepublicChadChileChinaColombiaComorosCongo, Dem. Rep.Congo, Rep.Costa RicaCote d'IvoireCroatiaCubaCyprusCzech RepublicDenmarkDjiboutiDominicaDominican RepublicEcuadorEgypt, Arab Rep.El SalvadorEquatorial GuineaEritreaEstoniaEthiopiaFijiFinlandFranceGabonGambia, TheGeorgiaGermanyGhanaGreeceGrenadaGuatemalaGuineaGuinea-BissauGuyanaHaitiHondurasHong Kong SAR, ChinaHungaryIcelandIndiaIndonesiaIran, Islamic Rep.IraqIrelandIsraelItalyJamaicaJapanJordanKazakhstanKenyaKorea, Dem. People’s Rep.Korea, Rep.KuwaitKyrgyz RepublicLao PDRLatviaLebanonLesothoLiberiaLibyaLithuaniaLuxembourgMacao SAR, ChinaMacedonia, FYRMadagascarMalawiMalaysiaMaldivesMaliMaltaMauritaniaMauritiusMexicoMoldovaMonacoMongoliaMontenegroMoroccoMozambiqueMyanmarNamibiaNepalNetherlandsNew ZealandNicaraguaNigerNigeriaNorwayOmanPakistanPanamaPapua New GuineaParaguayPeruPhilippinesPolandPortugalPuerto RicoQatarRomaniaRussian FederationRwandaSan MarinoSao Tome and PrincipeSaudi ArabiaSenegalSerbiaSierra LeoneSingaporeSlovak RepublicSloveniaSolomon IslandsSomaliaSouth AfricaSpainSri LankaSt. Kitts and NevisSt. LuciaSt. Vincent and the GrenadinesSudanSurinameSwazilandSwedenSwitzerlandSyrian Arab RepublicTajikistanTanzaniaThailandTimor-LesteTogoTrinidad and TobagoTunisiaTurkeyTurkmenistanUgandaUkraineUnited Arab EmiratesUnited KingdomUnited StatesUruguayUzbekistanVanuatuVenezuela, RBVietnamWest Bank and GazaYemen, Rep.ZambiaZimbabwe Timeline:
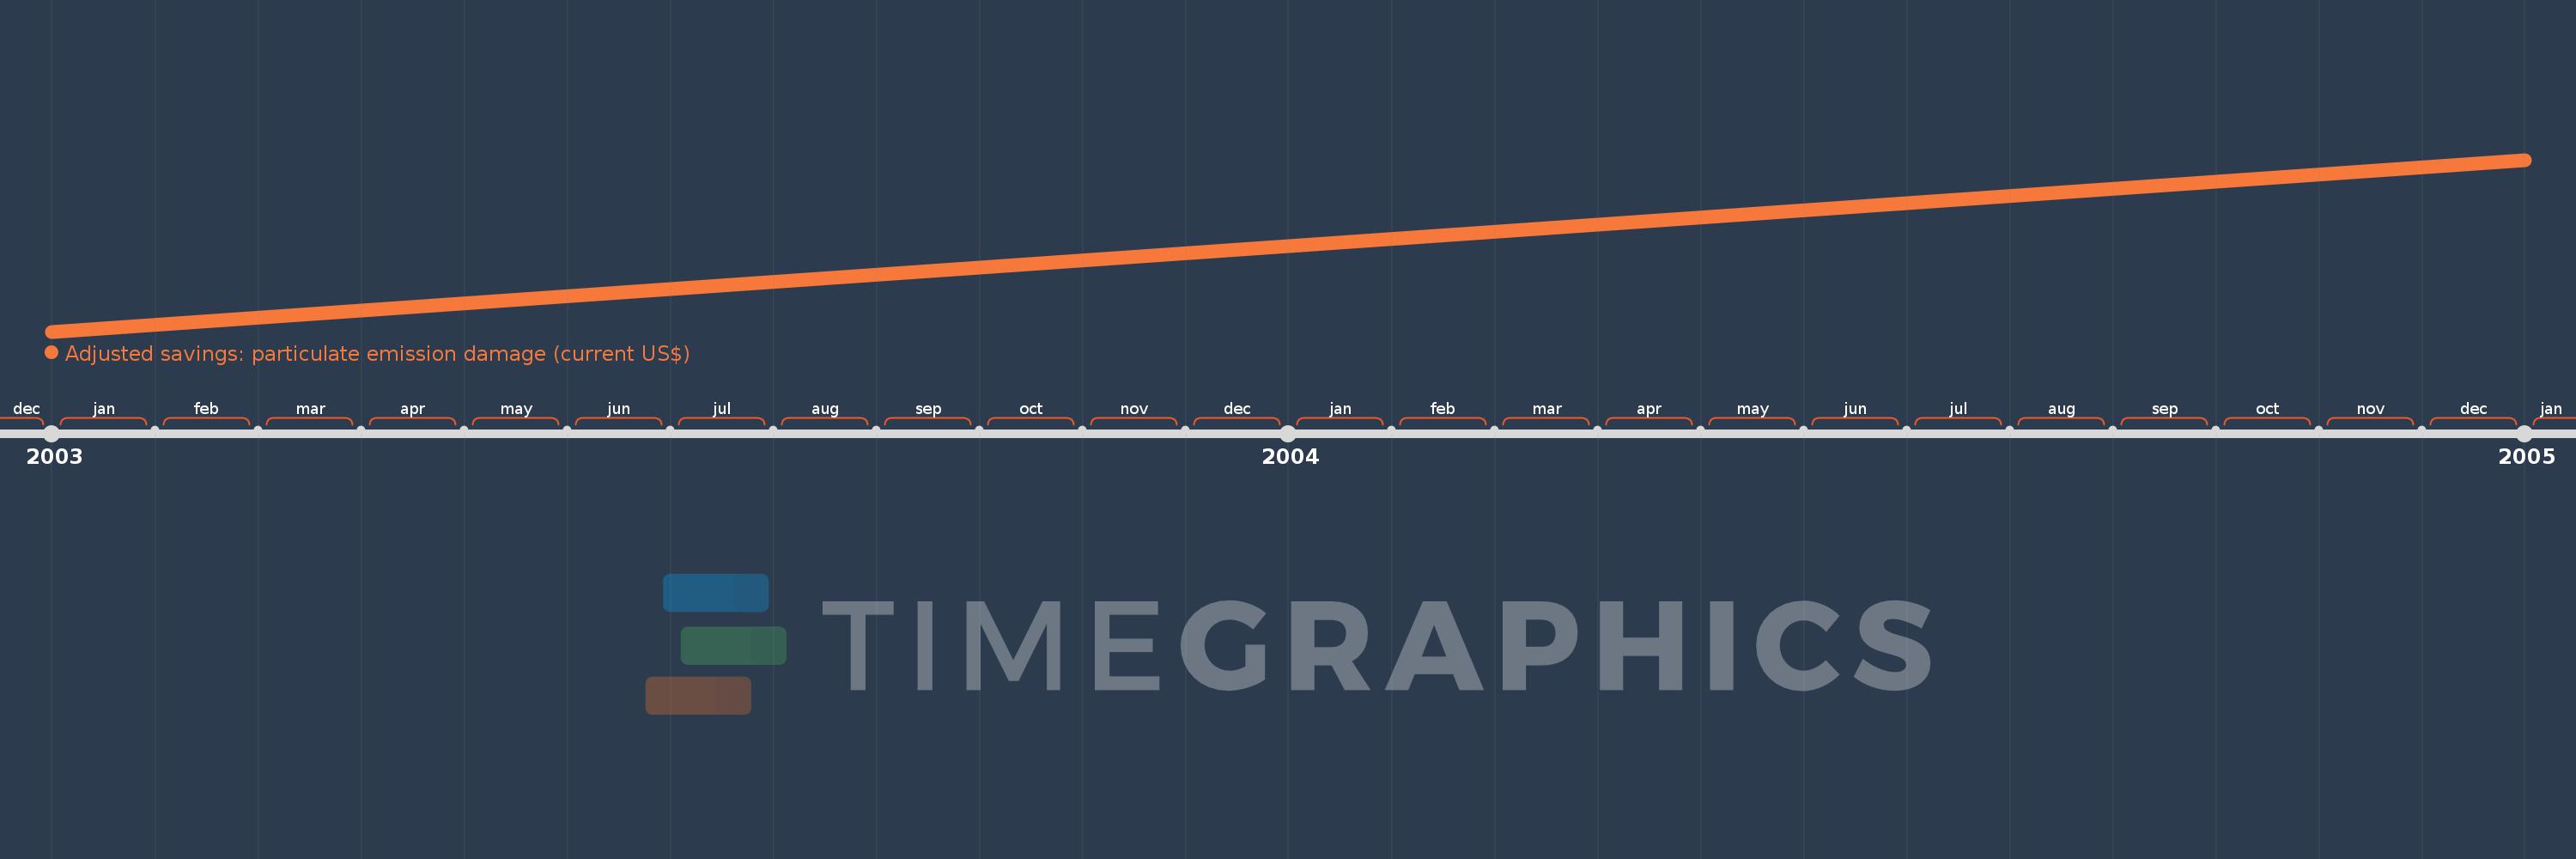
This timeline shows a graph from 2003 to 2005 of Andorra. No data until 2002. Number of actual observations by date: 2.
Source name:
World Development Indicators
Source organization:
Data on health impacts from exposure to ambient PM2.5 pollution and household air pollution are from the Global Burden of Disease 2010 study. Data are provided by the Institute for Health Metrics and Evaluation at the University of Washington.
Categories, topics:
Economy & Growth, Environment
Last updated:
apr 23, 2017
Indicators value changes by year
Minimum:
14.35 mln
jan 1, 2003
Maximum:
18.179 mln
jan 1, 2005
At the date of observation
Value
Absolute change
Change from the previous value
jan 1, 2003
14.35 mln
+14.35 mln
0.0%
jan 1, 2005
18.179 mln
+3.829 mln
26.68%
Ranking of countries by current statistics by years