33
/
AIzaSyAYiBZKx7MnpbEhh9jyipgxe19OcubqV5w
August 1, 2025
63193
Afghanistan
AFG
true
2
1
Adjusted savings: particulate emission damage (current US$)
2015,2014,2013,2012,2011,2010,2009,2008,2007,2006,2005,2004,2003,2002
Download
Global statistics library →Afghanistan →

Adjusted savings: particulate emission damage (current US$)

This statistics in other country:

AfghanistanAlbaniaAlgeriaAndorraAngolaAntigua and BarbudaArgentinaArmeniaAustraliaAustriaAzerbaijanBahamas, TheBahrainBangladeshBarbadosBelarusBelgiumBelizeBeninBhutanBoliviaBosnia and HerzegovinaBotswanaBrazilBrunei DarussalamBulgariaBurkina FasoBurundiCabo VerdeCambodiaCameroonCanadaCentral African RepublicChadChileChinaColombiaComorosCongo, Dem. Rep.Congo, Rep.Costa RicaCote d'IvoireCroatiaCubaCyprusCzech RepublicDenmarkDjiboutiDominicaDominican RepublicEcuadorEgypt, Arab Rep.El SalvadorEquatorial GuineaEritreaEstoniaEthiopiaFijiFinlandFranceGabonGambia, TheGeorgiaGermanyGhanaGreeceGrenadaGuatemalaGuineaGuinea-BissauGuyanaHaitiHondurasHong Kong SAR, ChinaHungaryIcelandIndiaIndonesiaIran, Islamic Rep.IraqIrelandIsraelItalyJamaicaJapanJordanKazakhstanKenyaKorea, Dem. People’s Rep.Korea, Rep.KuwaitKyrgyz RepublicLao PDRLatviaLebanonLesothoLiberiaLibyaLithuaniaLuxembourgMacao SAR, ChinaMacedonia, FYRMadagascarMalawiMalaysiaMaldivesMaliMaltaMauritaniaMauritiusMexicoMoldovaMonacoMongoliaMontenegroMoroccoMozambiqueMyanmarNamibiaNepalNetherlandsNew ZealandNicaraguaNigerNigeriaNorwayOmanPakistanPanamaPapua New GuineaParaguayPeruPhilippinesPolandPortugalPuerto RicoQatarRomaniaRussian FederationRwandaSan MarinoSao Tome and PrincipeSaudi ArabiaSenegalSerbiaSierra LeoneSingaporeSlovak RepublicSloveniaSolomon IslandsSomaliaSouth AfricaSpainSri LankaSt. Kitts and NevisSt. LuciaSt. Vincent and the GrenadinesSudanSurinameSwazilandSwedenSwitzerlandSyrian Arab RepublicTajikistanTanzaniaThailandTimor-LesteTogoTrinidad and TobagoTunisiaTurkeyTurkmenistanUgandaUkraineUnited Arab EmiratesUnited KingdomUnited StatesUruguayUzbekistanVanuatuVenezuela, RBVietnamWest Bank and GazaYemen, Rep.ZambiaZimbabwe

Timeline:

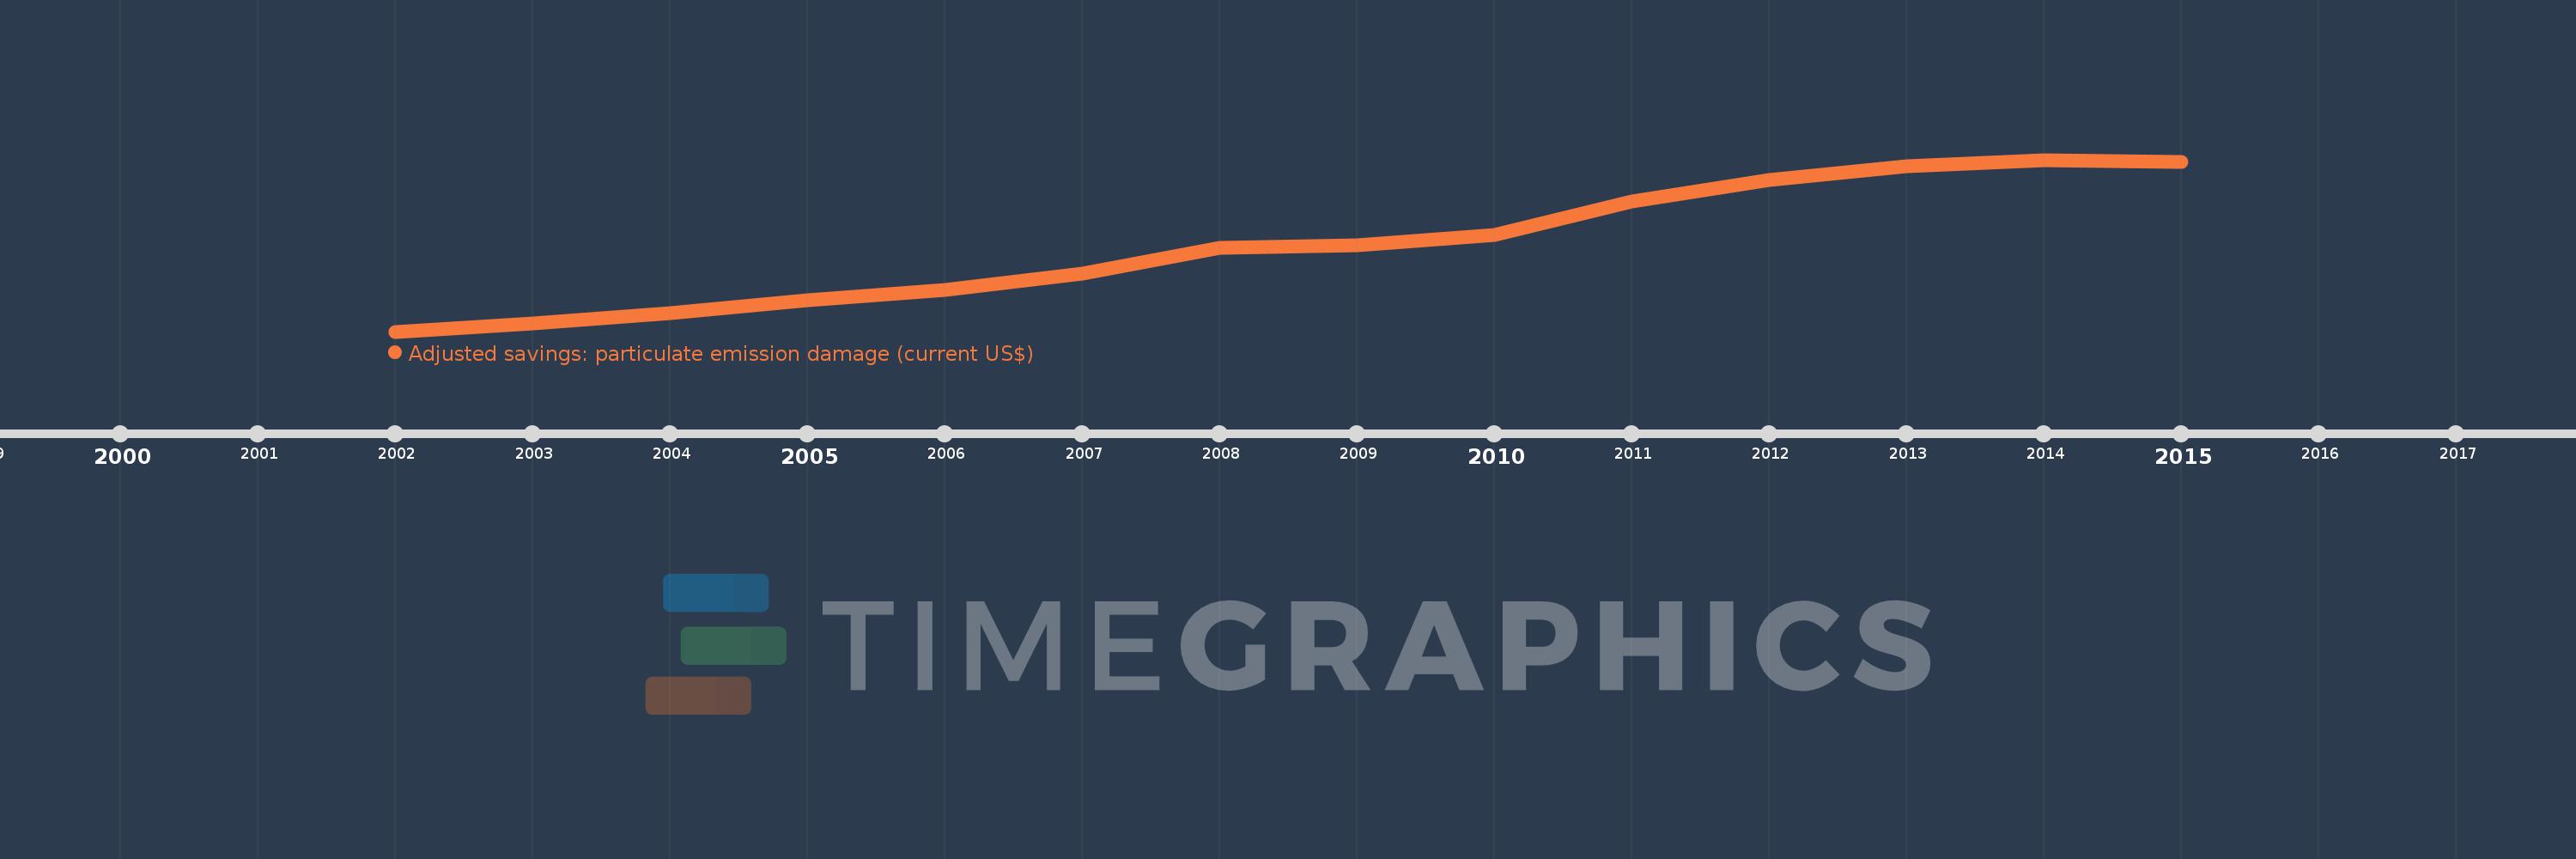
This timeline shows a graph from 2002 to 2015 of Afghanistan. No data until 2001. Number of actual observations by date: 14.

Source name:

World Development Indicators

Source organization:

Data on health impacts from exposure to ambient PM2.5 pollution and household air pollution are from the Global Burden of Disease 2010 study. Data are provided by the Institute for Health Metrics and Evaluation at the University of Washington.

Categories, topics:

Economy & Growth, Environment

Last updated:

apr 23, 2017

Indicators value changes by year

Meaning:
353.739 mln
Minimum:
109.293 mln
jan 1, 2002
Maximum:
594.285 mln
jan 1, 2014
At the date of observation
Value
Absolute change
Change from the previous value
jan 1, 2002
109.293 mln
+109.293 mln
0.0%
jan 1, 2003
133.127 mln
+23.834 mln
21.81%
jan 1, 2004
160.484 mln
+27.357 mln
20.55%
jan 1, 2005
197.695 mln
+37.212 mln
23.19%
jan 1, 2006
226.677 mln
+28.981 mln
14.66%
jan 1, 2007
273.527 mln
+46.85 mln
20.67%
jan 1, 2008
345.632 mln
+72.105 mln
26.36%
jan 1, 2009
353.409 mln
+7.777 mln
2.25%
jan 1, 2010
381.857 mln
+28.448 mln
8.05%
jan 1, 2011
475.548 mln
+93.69 mln
24.54%
jan 1, 2012
537.494 mln
+61.947 mln
13.03%
jan 1, 2013
575.888 mln
+38.394 mln
7.14%
jan 1, 2014
594.285 mln
+18.397 mln
3.19%
jan 1, 2015
587.428 mln
-6.857 mln
-1.15%

Ranking of countries by current statistics by years