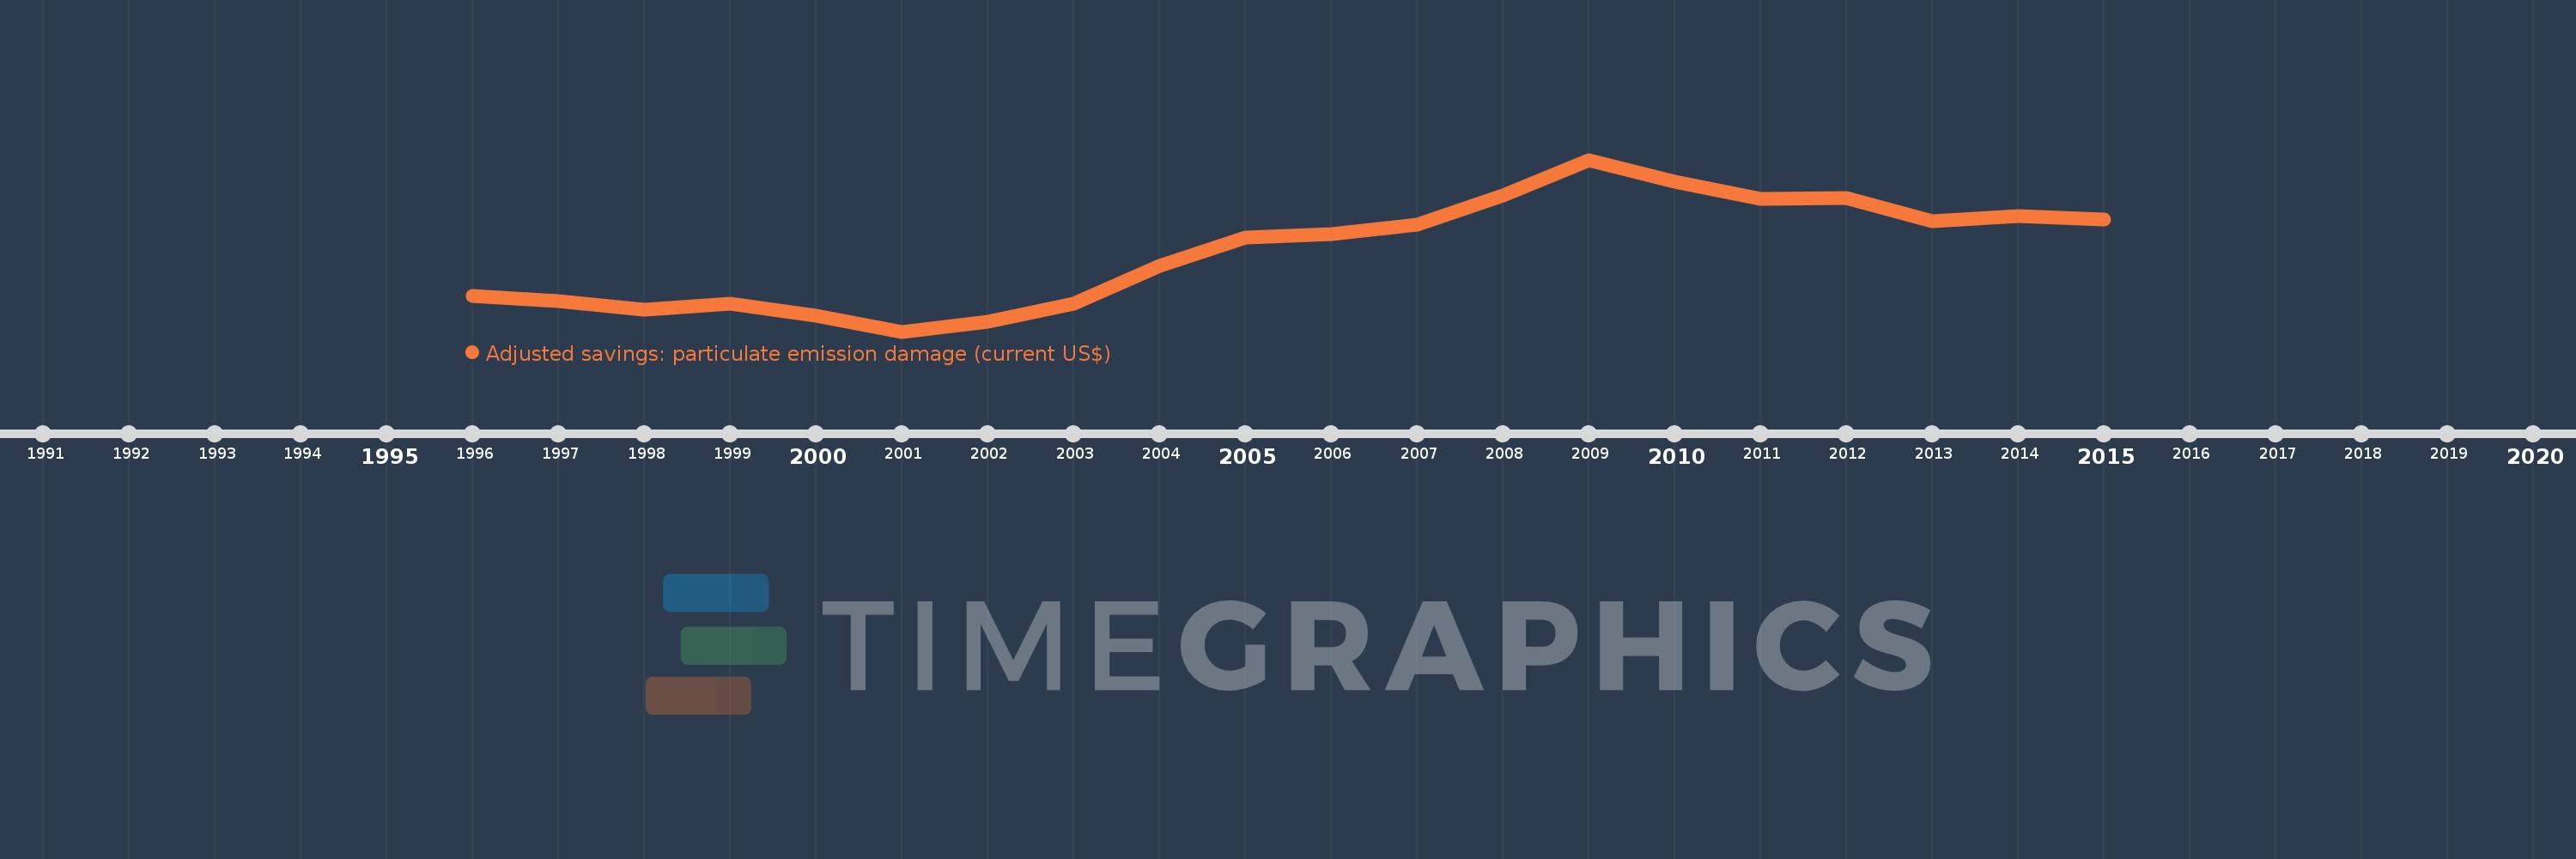
This timeline shows a graph from 1996 to 2015 of Croatia. No data until 1995. Number of actual observations by date: 20.
Source name:
World Development Indicators
Source organization:
Data on health impacts from exposure to ambient PM2.5 pollution and household air pollution are from the Global Burden of Disease 2010 study. Data are provided by the Institute for Health Metrics and Evaluation at the University of Washington.
Categories, topics:
Economy & Growth, Environment
Last updated:
apr 23, 2017
Indicators value changes by year
Meaning:
176.421 mln
Minimum:
115.062 mln
jan 1, 2001
Maximum:
247.102 mln
jan 1, 2009
At the date of observation
Value
Absolute change
Change from the previous value
jan 1, 1996
142.192 mln
+142.192 mln
0.0%
jan 1, 1997
138.479 mln
-3.713 mln
-2.61%
jan 1, 1998
132.224 mln
-6.255 mln
-4.52%
jan 1, 1999
136.301 mln
+4.077 mln
3.08%
jan 1, 2000
127.221 mln
-9.08 mln
-6.66%
jan 1, 2001
115.062 mln
-12.16 mln
-9.56%
jan 1, 2002
122.942 mln
+7.88 mln
6.85%
jan 1, 2003
136.222 mln
+13.28 mln
10.8%
jan 1, 2004
165.703 mln
+29.48 mln
21.64%
jan 1, 2005
187.654 mln
+21.952 mln
13.25%
jan 1, 2006
190.066 mln
+2.412 mln
1.29%
jan 1, 2007
197.416 mln
+7.35 mln
3.87%
jan 1, 2008
219.424 mln
+22.007 mln
11.15%
jan 1, 2009
247.102 mln
+27.678 mln
12.61%
jan 1, 2010
230.143 mln
-16.958 mln
-6.86%
jan 1, 2011
216.972 mln
-13.172 mln
-5.72%
jan 1, 2012
217.985 mln
+1.014 mln
0.47%
jan 1, 2013
199.845 mln
-18.14 mln
-8.32%
jan 1, 2014
204.145 mln
+4.301 mln
2.15%
jan 1, 2015
201.314 mln
-2.831 mln
-1.39%
Ranking of countries by current statistics by years