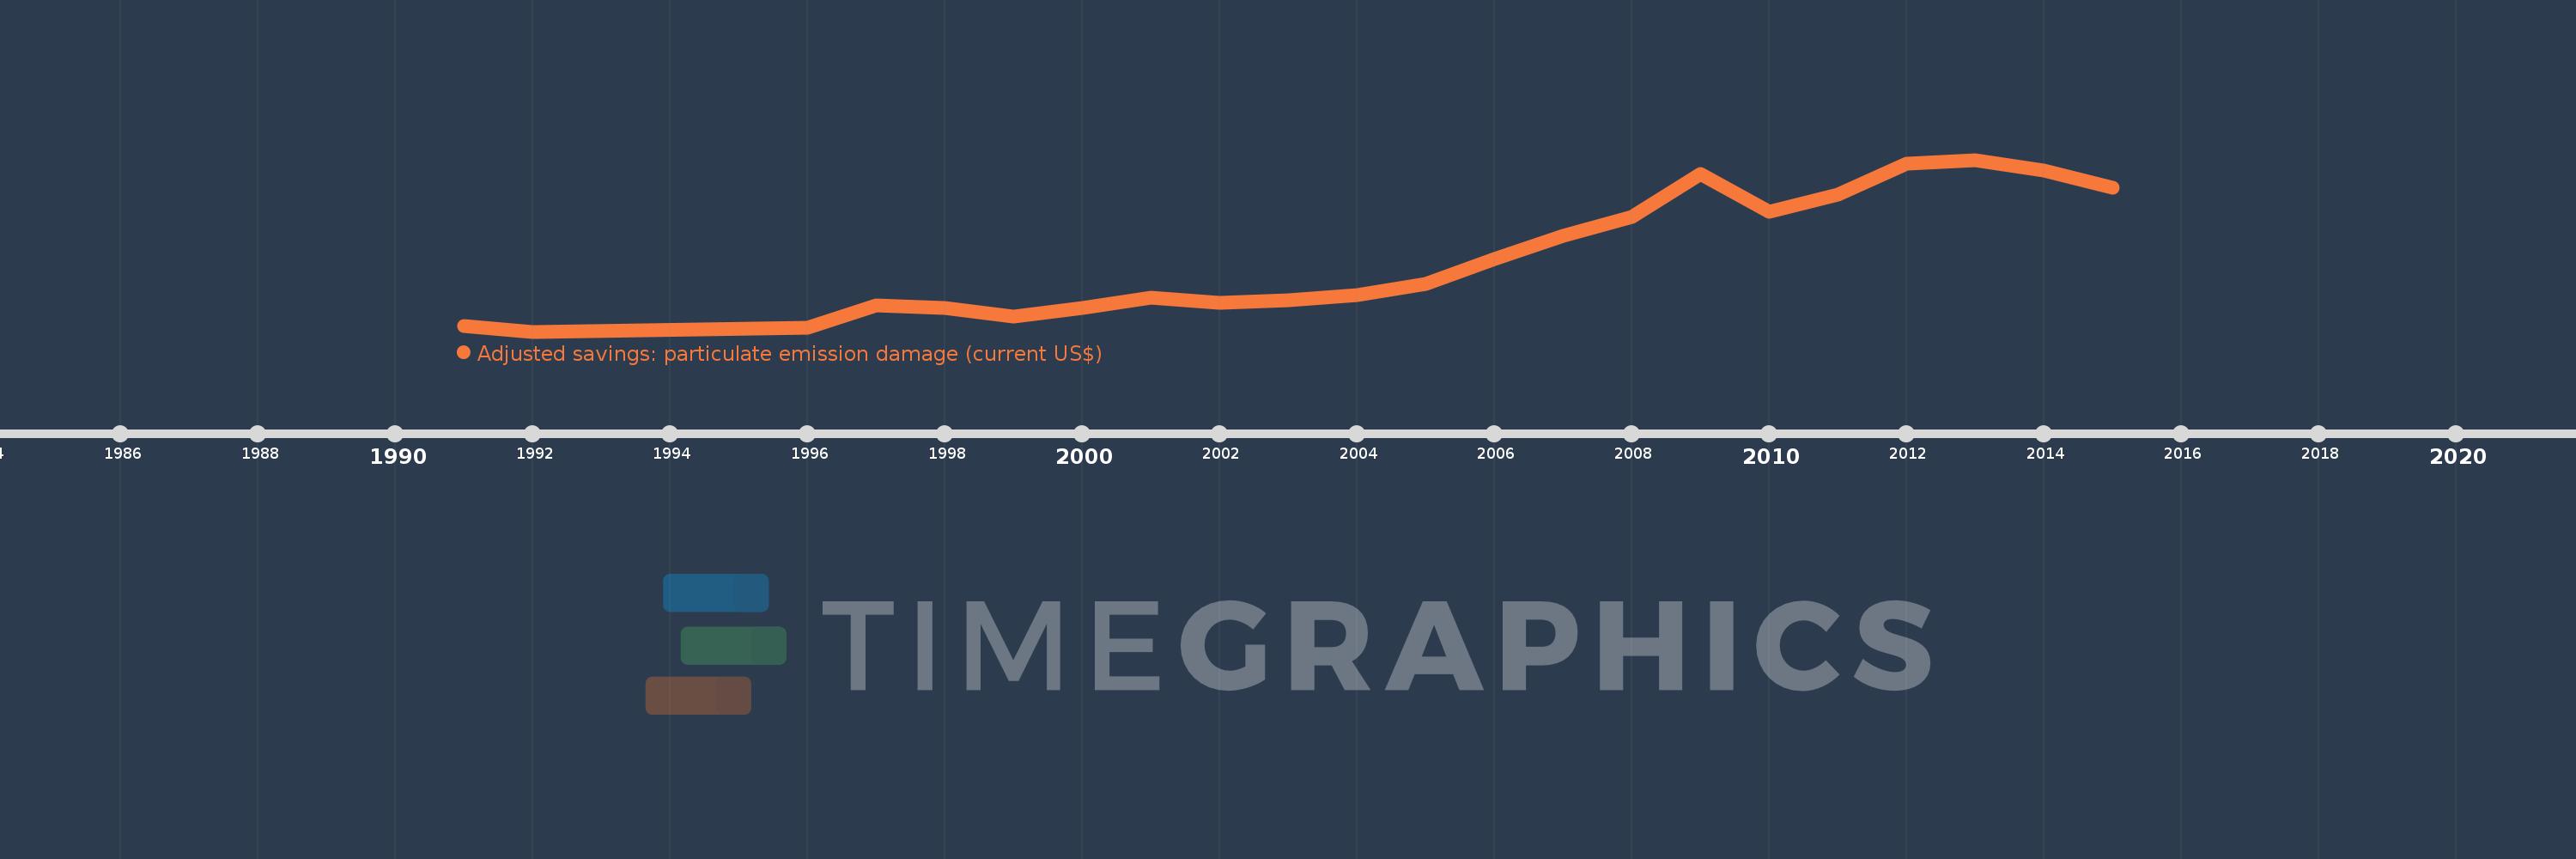
This timeline shows a graph from 1991 to 2015 of Kuwait. No data until 1990. Number of actual observations by date: 22.
Source name:
World Development Indicators
Source organization:
Data on health impacts from exposure to ambient PM2.5 pollution and household air pollution are from the Global Burden of Disease 2010 study. Data are provided by the Institute for Health Metrics and Evaluation at the University of Washington.
Categories, topics:
Economy & Growth, Environment
Last updated:
apr 23, 2017
Indicators value changes by year
Meaning:
75.8 mln
Minimum:
20.339 mln
jan 1, 1992
Maximum:
149.868 mln
jan 1, 2013
At the date of observation
Value
Absolute change
Change from the previous value
jan 1, 1991
24.371 mln
+24.371 mln
0.0%
jan 1, 1992
20.339 mln
-4.032 mln
-16.55%
jan 1, 1996
23.151 mln
+2.812 mln
13.82%
jan 1, 1997
40.096 mln
+16.945 mln
73.2%
jan 1, 1998
37.827 mln
-2.269 mln
-5.66%
jan 1, 1999
31.893 mln
-5.934 mln
-15.69%
jan 1, 2000
38.172 mln
+6.279 mln
19.69%
jan 1, 2001
45.964 mln
+7.792 mln
20.41%
jan 1, 2002
41.746 mln
-4.218 mln
-9.18%
jan 1, 2003
43.726 mln
+1.98 mln
4.74%
jan 1, 2004
47.626 mln
+3.9 mln
8.92%
jan 1, 2005
56.478 mln
+8.852 mln
18.59%
jan 1, 2006
75.34 mln
+18.862 mln
33.4%
jan 1, 2007
92.85 mln
+17.51 mln
23.24%
jan 1, 2008
106.54 mln
+13.69 mln
14.74%
jan 1, 2009
139.453 mln
+32.913 mln
30.89%
jan 1, 2010
110.477 mln
-28.976 mln
-20.78%
jan 1, 2011
123.89 mln
+13.413 mln
12.14%
jan 1, 2012
147.105 mln
+23.215 mln
18.74%
jan 1, 2013
149.868 mln
+2.763 mln
1.88%
jan 1, 2014
141.993 mln
-7.875 mln
-5.25%
jan 1, 2015
128.694 mln
-13.299 mln
-9.37%
Ranking of countries by current statistics by years