33
/
AIzaSyAYiBZKx7MnpbEhh9jyipgxe19OcubqV5w
August 1, 2025
263185
Timor-Leste
TLS
true
2
1
Adjusted savings: particulate emission damage (current US$)
2015,2014,2013,2012,2011,2010,2009,2008,2007,2006,2005,2004,2003,2002,2001
Download
Global statistics library →Timor-Leste →

Adjusted savings: particulate emission damage (current US$)

This statistics in other country:

AfghanistanAlbaniaAlgeriaAndorraAngolaAntigua and BarbudaArgentinaArmeniaAustraliaAustriaAzerbaijanBahamas, TheBahrainBangladeshBarbadosBelarusBelgiumBelizeBeninBhutanBoliviaBosnia and HerzegovinaBotswanaBrazilBrunei DarussalamBulgariaBurkina FasoBurundiCabo VerdeCambodiaCameroonCanadaCentral African RepublicChadChileChinaColombiaComorosCongo, Dem. Rep.Congo, Rep.Costa RicaCote d'IvoireCroatiaCubaCyprusCzech RepublicDenmarkDjiboutiDominicaDominican RepublicEcuadorEgypt, Arab Rep.El SalvadorEquatorial GuineaEritreaEstoniaEthiopiaFijiFinlandFranceGabonGambia, TheGeorgiaGermanyGhanaGreeceGrenadaGuatemalaGuineaGuinea-BissauGuyanaHaitiHondurasHong Kong SAR, ChinaHungaryIcelandIndiaIndonesiaIran, Islamic Rep.IraqIrelandIsraelItalyJamaicaJapanJordanKazakhstanKenyaKorea, Dem. People’s Rep.Korea, Rep.KuwaitKyrgyz RepublicLao PDRLatviaLebanonLesothoLiberiaLibyaLithuaniaLuxembourgMacao SAR, ChinaMacedonia, FYRMadagascarMalawiMalaysiaMaldivesMaliMaltaMauritaniaMauritiusMexicoMoldovaMonacoMongoliaMontenegroMoroccoMozambiqueMyanmarNamibiaNepalNetherlandsNew ZealandNicaraguaNigerNigeriaNorwayOmanPakistanPanamaPapua New GuineaParaguayPeruPhilippinesPolandPortugalPuerto RicoQatarRomaniaRussian FederationRwandaSan MarinoSao Tome and PrincipeSaudi ArabiaSenegalSerbiaSierra LeoneSingaporeSlovak RepublicSloveniaSolomon IslandsSomaliaSouth AfricaSpainSri LankaSt. Kitts and NevisSt. LuciaSt. Vincent and the GrenadinesSudanSurinameSwazilandSwedenSwitzerlandSyrian Arab RepublicTajikistanTanzaniaThailandTimor-LesteTogoTrinidad and TobagoTunisiaTurkeyTurkmenistanUgandaUkraineUnited Arab EmiratesUnited KingdomUnited StatesUruguayUzbekistanVanuatuVenezuela, RBVietnamWest Bank and GazaYemen, Rep.ZambiaZimbabwe

Timeline:

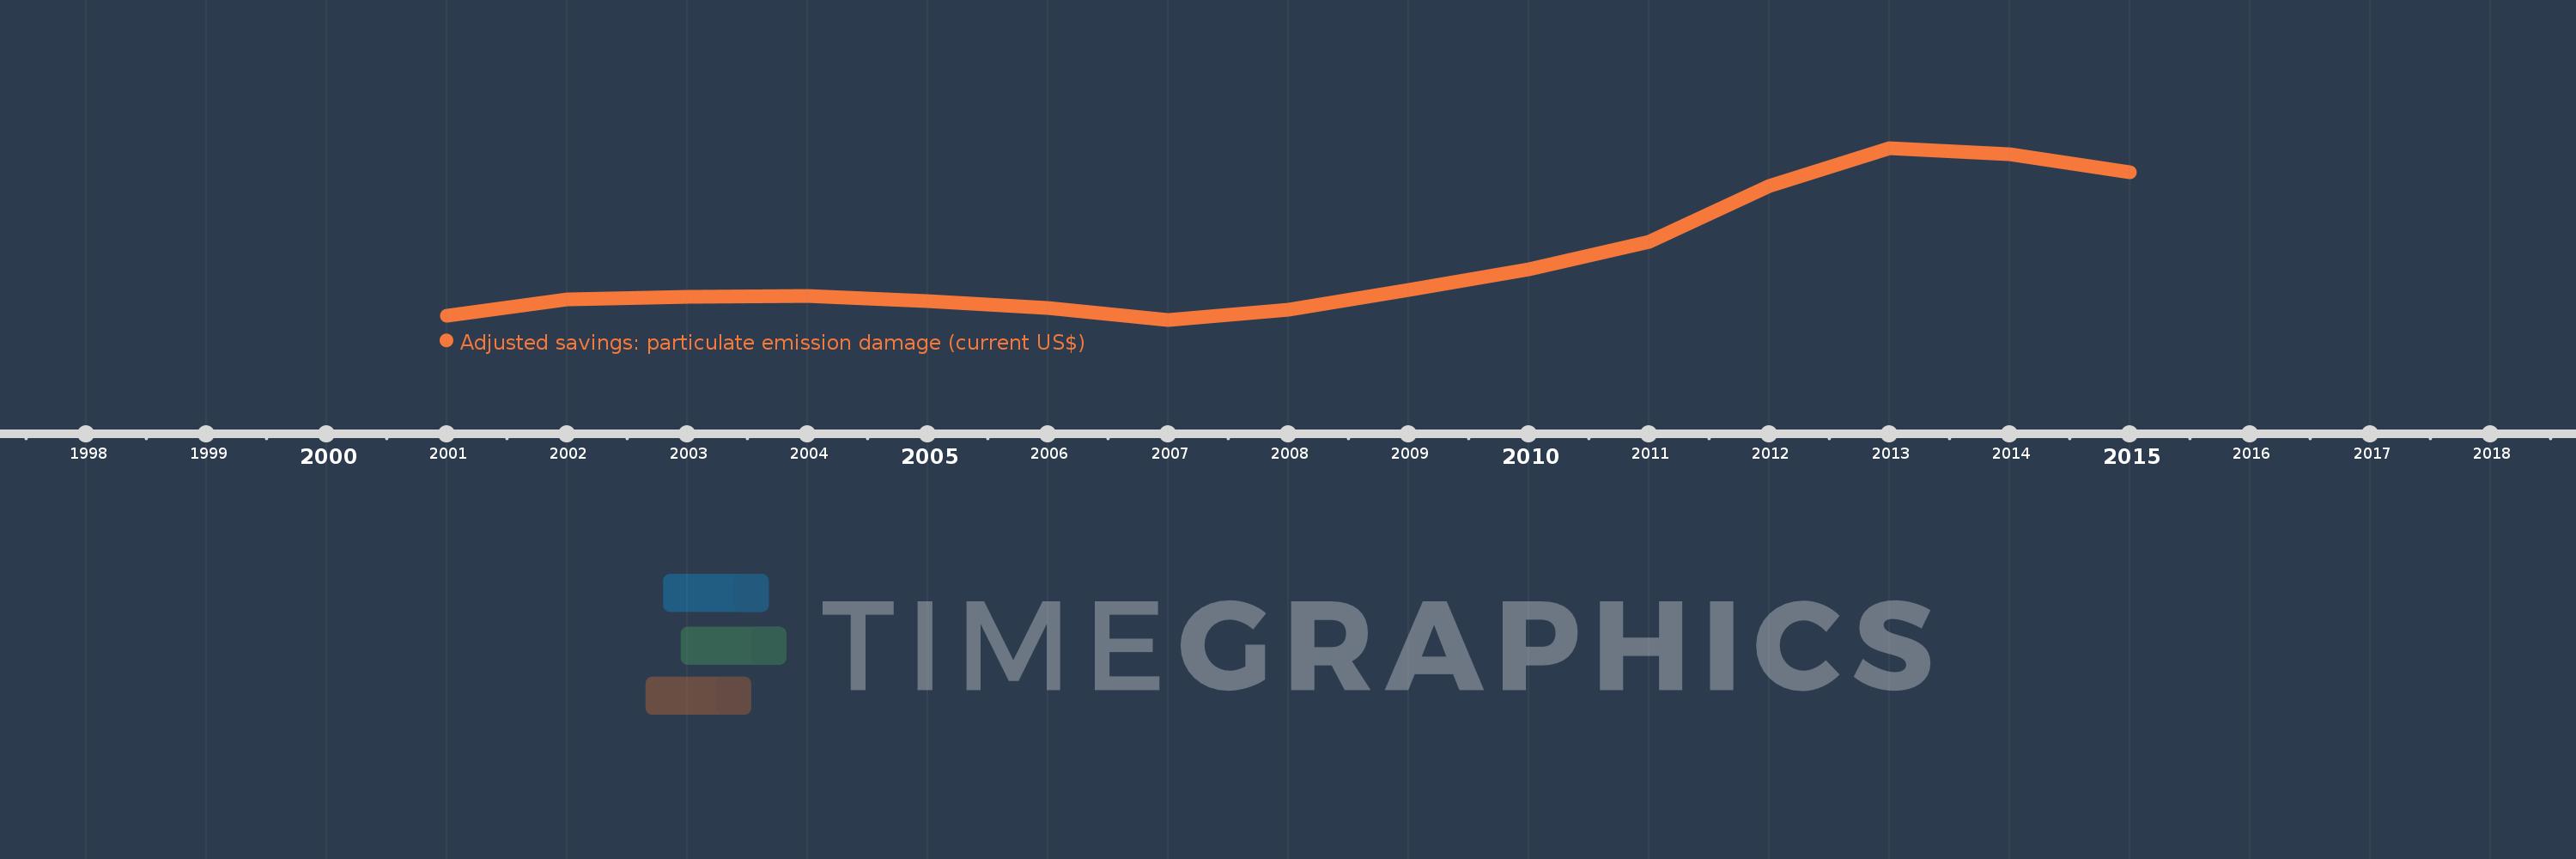
This timeline shows a graph from 2001 to 2015 of Timor-Leste. No data until 2000. Number of actual observations by date: 15.

Source name:

World Development Indicators

Source organization:

Data on health impacts from exposure to ambient PM2.5 pollution and household air pollution are from the Global Burden of Disease 2010 study. Data are provided by the Institute for Health Metrics and Evaluation at the University of Washington.

Categories, topics:

Economy & Growth, Environment

Last updated:

apr 23, 2017

Indicators value changes by year

Meaning:
9.064 mln
Minimum:
6.827 mln
jan 1, 2007
Maximum:
13.323 mln
jan 1, 2013
At the date of observation
Value
Absolute change
Change from the previous value
jan 1, 2001
6.973 mln
+6.973 mln
0.0%
jan 1, 2002
7.59 mln
+617.222K
8.85%
jan 1, 2003
7.687 mln
+97.247K
1.28%
jan 1, 2004
7.718 mln
+30.55K
0.4%
jan 1, 2005
7.548 mln
-170.207K
-2.21%
jan 1, 2006
7.277 mln
-270.929K
-3.59%
jan 1, 2007
6.827 mln
-449.352K
-6.18%
jan 1, 2008
7.195 mln
+367.155K
5.38%
jan 1, 2009
7.955 mln
+760.46K
10.57%
jan 1, 2010
8.731 mln
+775.964K
9.75%
jan 1, 2011
9.76 mln
+1.029 mln
11.79%
jan 1, 2012
11.876 mln
+2.116 mln
21.68%
jan 1, 2013
13.323 mln
+1.447 mln
12.18%
jan 1, 2014
13.099 mln
-223.387K
-1.68%
jan 1, 2015
12.399 mln
-700.427K
-5.35%

Ranking of countries by current statistics by years