33
/
AIzaSyAYiBZKx7MnpbEhh9jyipgxe19OcubqV5w
August 1, 2025
180782
Lithuania
LTU
true
2
1
Adjusted savings: particulate emission damage (current US$)
2015,2014,2013,2012,2011,2010,2009,2008,2007,2006,2005,2004,2003,2002,2001,2000,1999,1998,1997,1996
Download
Global statistics library →Lithuania →

Adjusted savings: particulate emission damage (current US$)

This statistics in other country:

AfghanistanAlbaniaAlgeriaAndorraAngolaAntigua and BarbudaArgentinaArmeniaAustraliaAustriaAzerbaijanBahamas, TheBahrainBangladeshBarbadosBelarusBelgiumBelizeBeninBhutanBoliviaBosnia and HerzegovinaBotswanaBrazilBrunei DarussalamBulgariaBurkina FasoBurundiCabo VerdeCambodiaCameroonCanadaCentral African RepublicChadChileChinaColombiaComorosCongo, Dem. Rep.Congo, Rep.Costa RicaCote d'IvoireCroatiaCubaCyprusCzech RepublicDenmarkDjiboutiDominicaDominican RepublicEcuadorEgypt, Arab Rep.El SalvadorEquatorial GuineaEritreaEstoniaEthiopiaFijiFinlandFranceGabonGambia, TheGeorgiaGermanyGhanaGreeceGrenadaGuatemalaGuineaGuinea-BissauGuyanaHaitiHondurasHong Kong SAR, ChinaHungaryIcelandIndiaIndonesiaIran, Islamic Rep.IraqIrelandIsraelItalyJamaicaJapanJordanKazakhstanKenyaKorea, Dem. People’s Rep.Korea, Rep.KuwaitKyrgyz RepublicLao PDRLatviaLebanonLesothoLiberiaLibyaLithuaniaLuxembourgMacao SAR, ChinaMacedonia, FYRMadagascarMalawiMalaysiaMaldivesMaliMaltaMauritaniaMauritiusMexicoMoldovaMonacoMongoliaMontenegroMoroccoMozambiqueMyanmarNamibiaNepalNetherlandsNew ZealandNicaraguaNigerNigeriaNorwayOmanPakistanPanamaPapua New GuineaParaguayPeruPhilippinesPolandPortugalPuerto RicoQatarRomaniaRussian FederationRwandaSan MarinoSao Tome and PrincipeSaudi ArabiaSenegalSerbiaSierra LeoneSingaporeSlovak RepublicSloveniaSolomon IslandsSomaliaSouth AfricaSpainSri LankaSt. Kitts and NevisSt. LuciaSt. Vincent and the GrenadinesSudanSurinameSwazilandSwedenSwitzerlandSyrian Arab RepublicTajikistanTanzaniaThailandTimor-LesteTogoTrinidad and TobagoTunisiaTurkeyTurkmenistanUgandaUkraineUnited Arab EmiratesUnited KingdomUnited StatesUruguayUzbekistanVanuatuVenezuela, RBVietnamWest Bank and GazaYemen, Rep.ZambiaZimbabwe

Timeline:

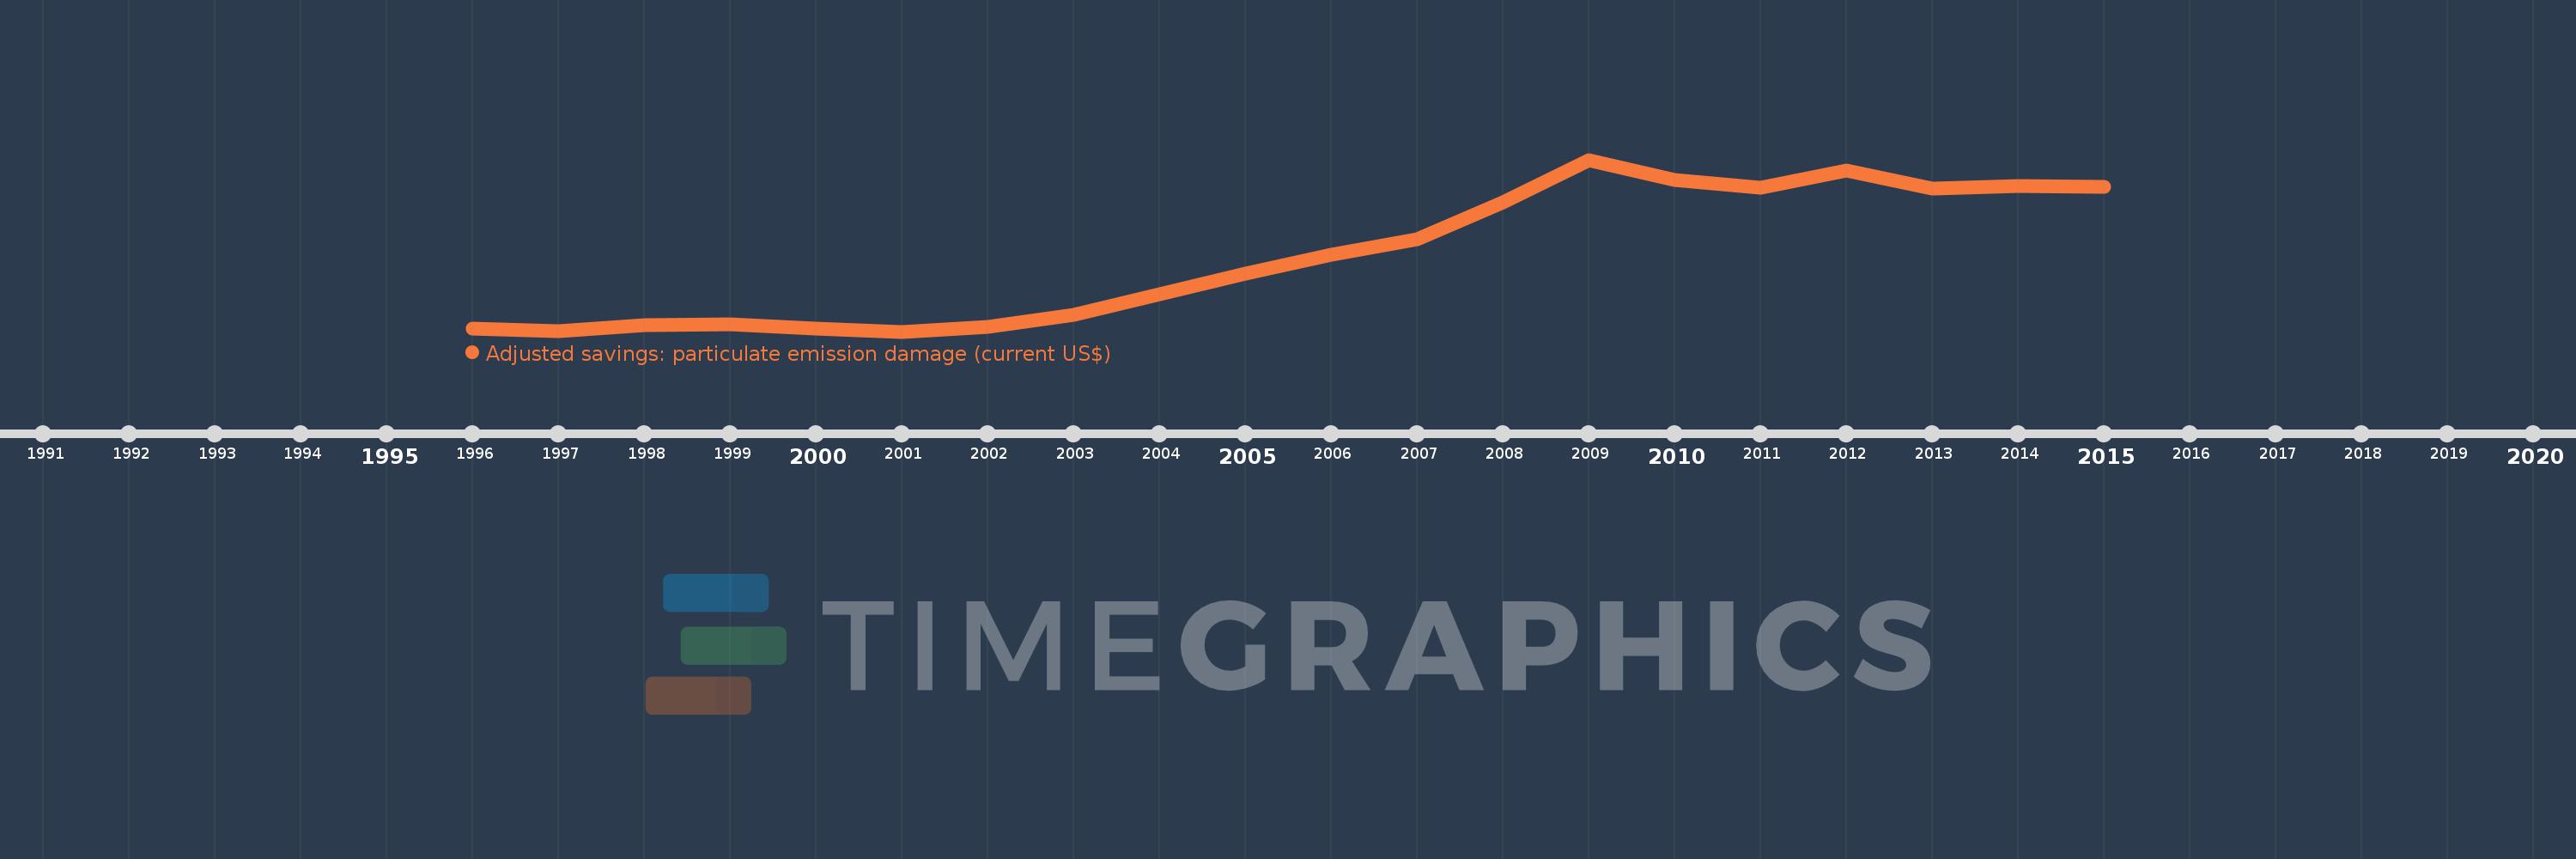
This timeline shows a graph from 1996 to 2015 of Lithuania. No data until 1995. Number of actual observations by date: 20.

Source name:

World Development Indicators

Source organization:

Data on health impacts from exposure to ambient PM2.5 pollution and household air pollution are from the Global Burden of Disease 2010 study. Data are provided by the Institute for Health Metrics and Evaluation at the University of Washington.

Categories, topics:

Economy & Growth, Environment

Last updated:

apr 23, 2017

Indicators value changes by year

Meaning:
90.088 mln
Minimum:
43.742 mln
jan 1, 2001
Maximum:
150.031 mln
jan 1, 2009
At the date of observation
Value
Absolute change
Change from the previous value
jan 1, 1996
45.565 mln
+45.565 mln
0.0%
jan 1, 1997
44.095 mln
-1.47 mln
-3.23%
jan 1, 1998
47.821 mln
+3.726 mln
8.45%
jan 1, 1999
48.516 mln
+695.133K
1.45%
jan 1, 2000
45.468 mln
-3.048 mln
-6.28%
jan 1, 2001
43.742 mln
-1.726 mln
-3.8%
jan 1, 2002
46.759 mln
+3.017 mln
6.9%
jan 1, 2003
53.903 mln
+7.144 mln
15.28%
jan 1, 2004
66.887 mln
+12.983 mln
24.09%
jan 1, 2005
79.687 mln
+12.8 mln
19.14%
jan 1, 2006
91.568 mln
+11.881 mln
14.91%
jan 1, 2007
100.896 mln
+9.328 mln
10.19%
jan 1, 2008
123.731 mln
+22.835 mln
22.63%
jan 1, 2009
150.031 mln
+26.3 mln
21.26%
jan 1, 2010
137.371 mln
-12.66 mln
-8.44%
jan 1, 2011
132.494 mln
-4.877 mln
-3.55%
jan 1, 2012
143.487 mln
+10.993 mln
8.3%
jan 1, 2013
132.351 mln
-11.135 mln
-7.76%
jan 1, 2014
133.875 mln
+1.524 mln
1.15%
jan 1, 2015
133.515 mln
-360.269K
-0.27%

Ranking of countries by current statistics by years