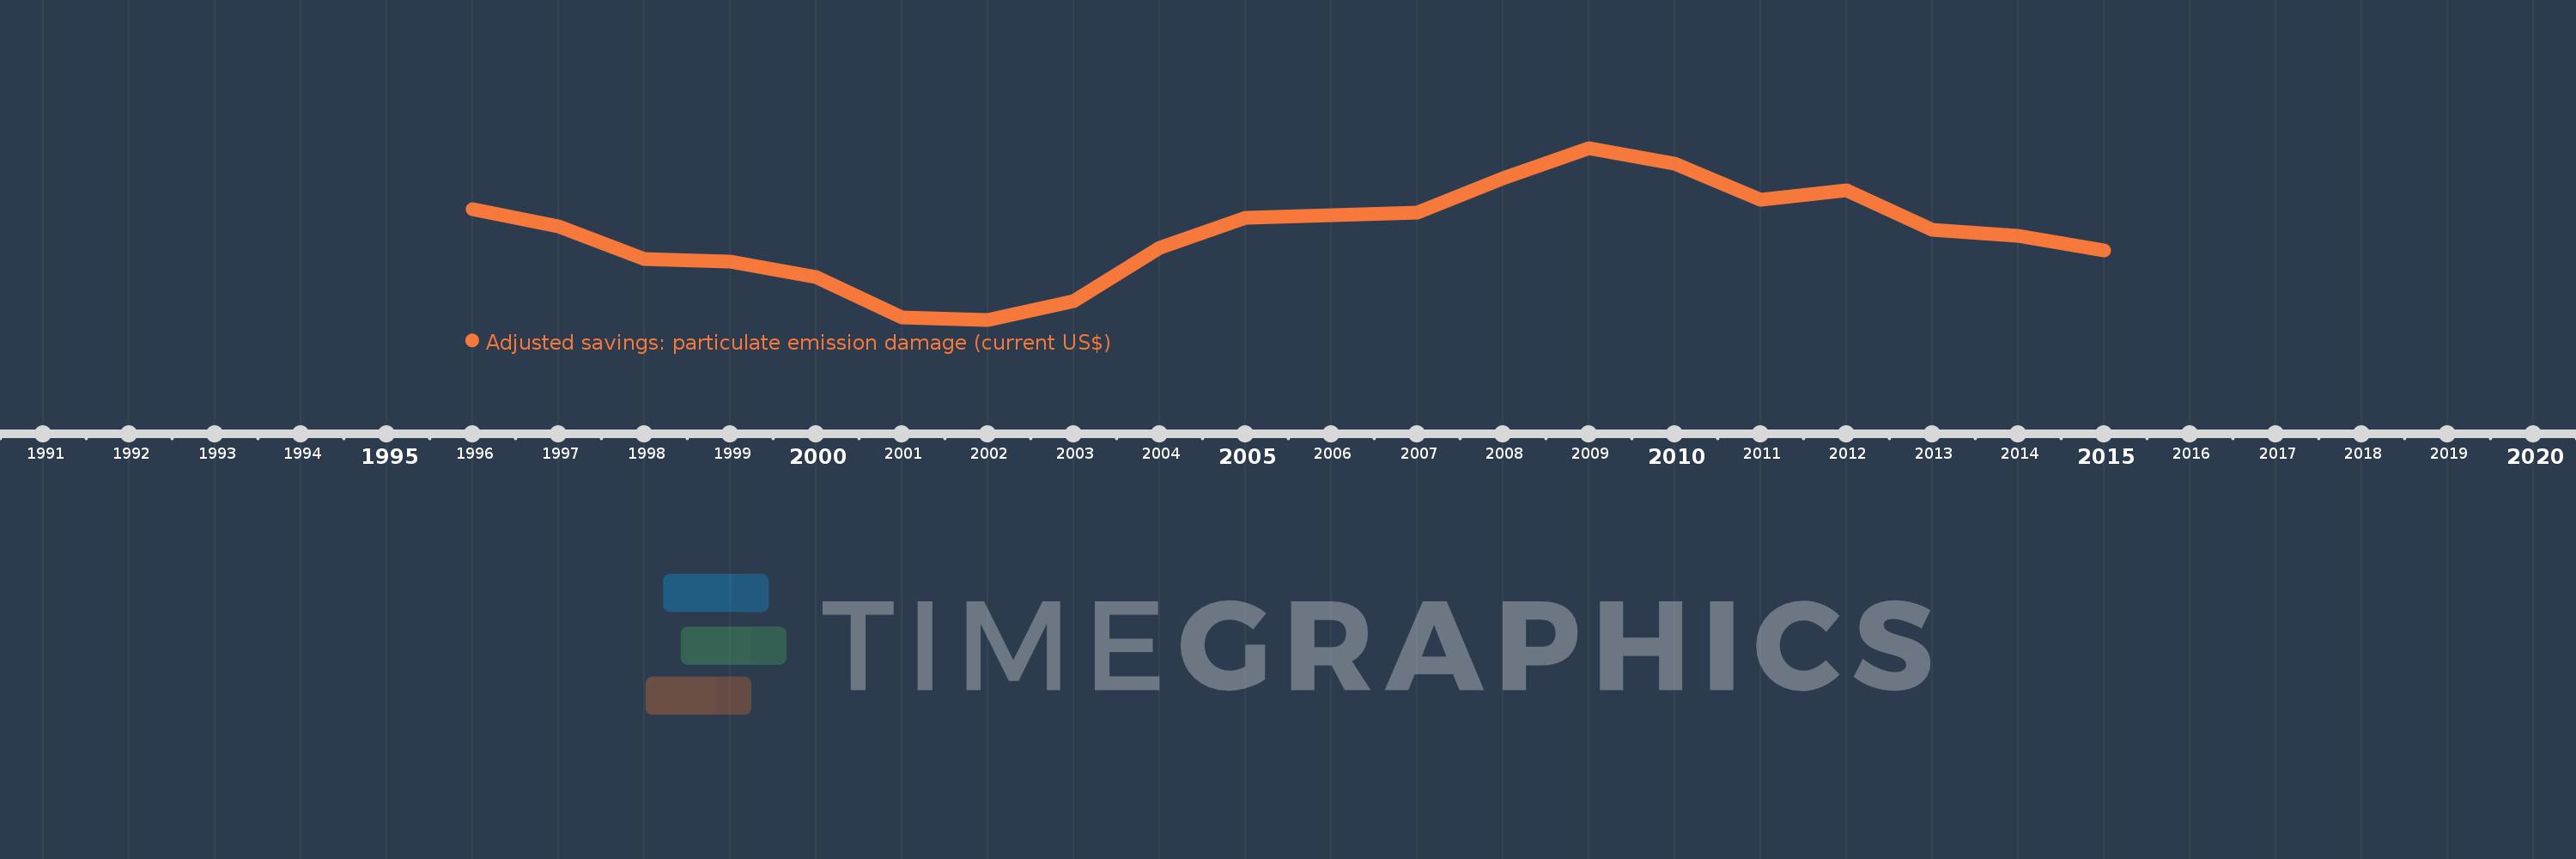
This timeline shows a graph from 1996 to 2015 of Slovenia. No data until 1995. Number of actual observations by date: 20.
Source name:
World Development Indicators
Source organization:
Data on health impacts from exposure to ambient PM2.5 pollution and household air pollution are from the Global Burden of Disease 2010 study. Data are provided by the Institute for Health Metrics and Evaluation at the University of Washington.
Categories, topics:
Economy & Growth, Environment
Last updated:
apr 23, 2017
Indicators value changes by year
Meaning:
87.726 mln
Minimum:
62.23 mln
jan 1, 2002
Maximum:
112.802 mln
jan 1, 2009
At the date of observation
Value
Absolute change
Change from the previous value
jan 1, 1996
94.747 mln
+94.747 mln
0.0%
jan 1, 1997
89.606 mln
-5.141 mln
-5.43%
jan 1, 1998
80.19 mln
-9.416 mln
-10.51%
jan 1, 1999
79.304 mln
-885.052K
-1.1%
jan 1, 2000
74.671 mln
-4.634 mln
-5.84%
jan 1, 2001
62.868 mln
-11.803 mln
-15.81%
jan 1, 2002
62.23 mln
-638.436K
-1.02%
jan 1, 2003
67.729 mln
+5.499 mln
8.84%
jan 1, 2004
83.324 mln
+15.595 mln
23.03%
jan 1, 2005
92.293 mln
+8.969 mln
10.76%
jan 1, 2006
92.923 mln
+629.98K
0.68%
jan 1, 2007
93.661 mln
+737.576K
0.79%
jan 1, 2008
103.825 mln
+10.164 mln
10.85%
jan 1, 2009
112.802 mln
+8.977 mln
8.65%
jan 1, 2010
108.061 mln
-4.741 mln
-4.2%
jan 1, 2011
97.549 mln
-10.512 mln
-9.73%
jan 1, 2012
100.339 mln
+2.79 mln
2.86%
jan 1, 2013
88.774 mln
-11.565 mln
-11.53%
jan 1, 2014
86.988 mln
-1.786 mln
-2.01%
jan 1, 2015
82.641 mln
-4.347 mln
-5.0%
Ranking of countries by current statistics by years