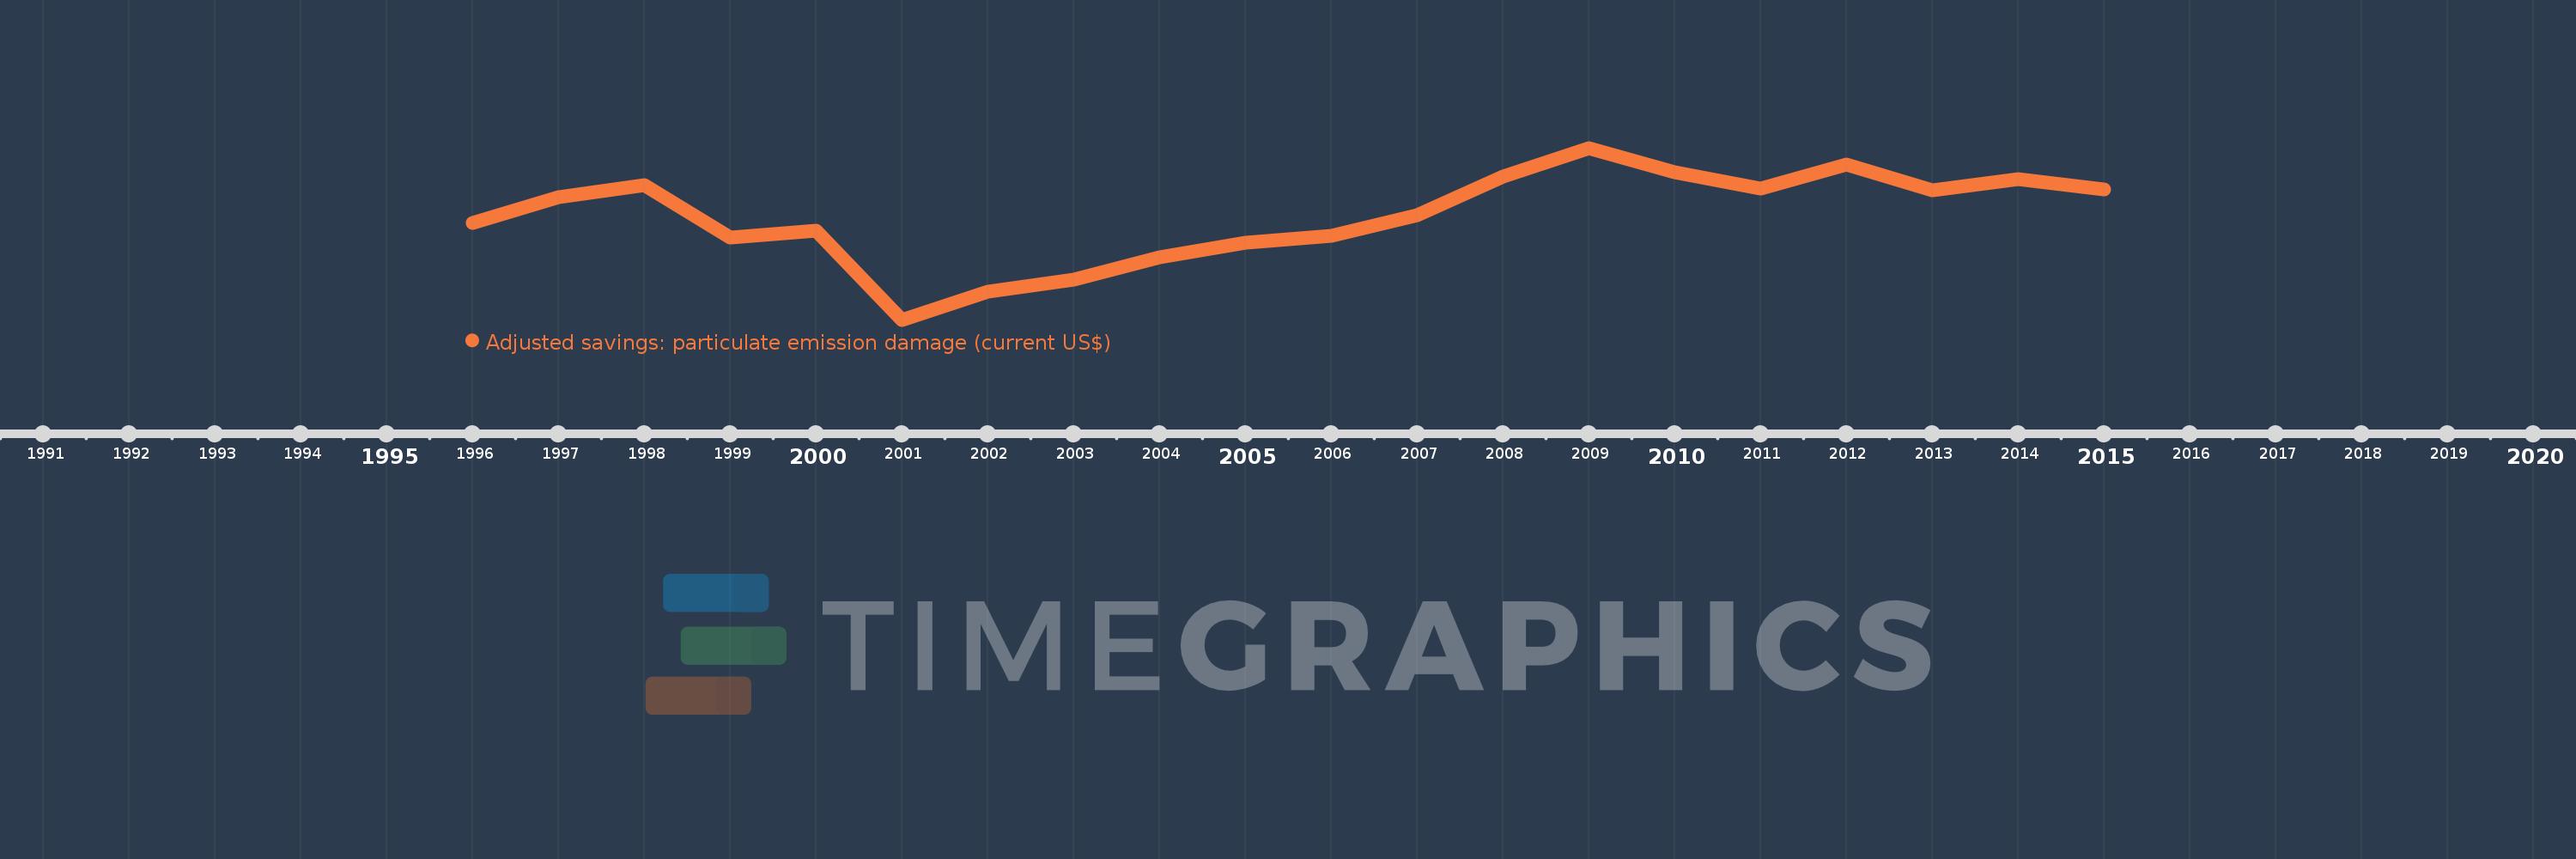
This timeline shows a graph from 1996 to 2015 of Serbia. No data until 1995. Number of actual observations by date: 20.
Source name:
World Development Indicators
Source organization:
Data on health impacts from exposure to ambient PM2.5 pollution and household air pollution are from the Global Burden of Disease 2010 study. Data are provided by the Institute for Health Metrics and Evaluation at the University of Washington.
Categories, topics:
Economy & Growth, Environment
Last updated:
apr 23, 2017
Indicators value changes by year
Meaning:
188.51 mln
Minimum:
51.911 mln
jan 1, 2001
Maximum:
278.674 mln
jan 1, 2009
At the date of observation
Value
Absolute change
Change from the previous value
jan 1, 1996
179.326 mln
+179.326 mln
0.0%
jan 1, 1997
214.179 mln
+34.853 mln
19.44%
jan 1, 1998
229.118 mln
+14.939 mln
6.98%
jan 1, 1999
160.046 mln
-69.072 mln
-30.15%
jan 1, 2000
169.938 mln
+9.892 mln
6.18%
jan 1, 2001
51.911 mln
-118.027 mln
-69.45%
jan 1, 2002
89.034 mln
+37.123 mln
71.51%
jan 1, 2003
105.337 mln
+16.303 mln
18.31%
jan 1, 2004
134.395 mln
+29.058 mln
27.59%
jan 1, 2005
153.335 mln
+18.939 mln
14.09%
jan 1, 2006
162.91 mln
+9.575 mln
6.24%
jan 1, 2007
189.455 mln
+26.545 mln
16.29%
jan 1, 2008
240.476 mln
+51.021 mln
26.93%
jan 1, 2009
278.674 mln
+38.199 mln
15.88%
jan 1, 2010
246.337 mln
-32.337 mln
-11.6%
jan 1, 2011
224.88 mln
-21.458 mln
-8.71%
jan 1, 2012
257.1 mln
+32.22 mln
14.33%
jan 1, 2013
222.981 mln
-34.119 mln
-13.27%
jan 1, 2014
237.106 mln
+14.125 mln
6.33%
jan 1, 2015
223.655 mln
-13.452 mln
-5.67%
Ranking of countries by current statistics by years