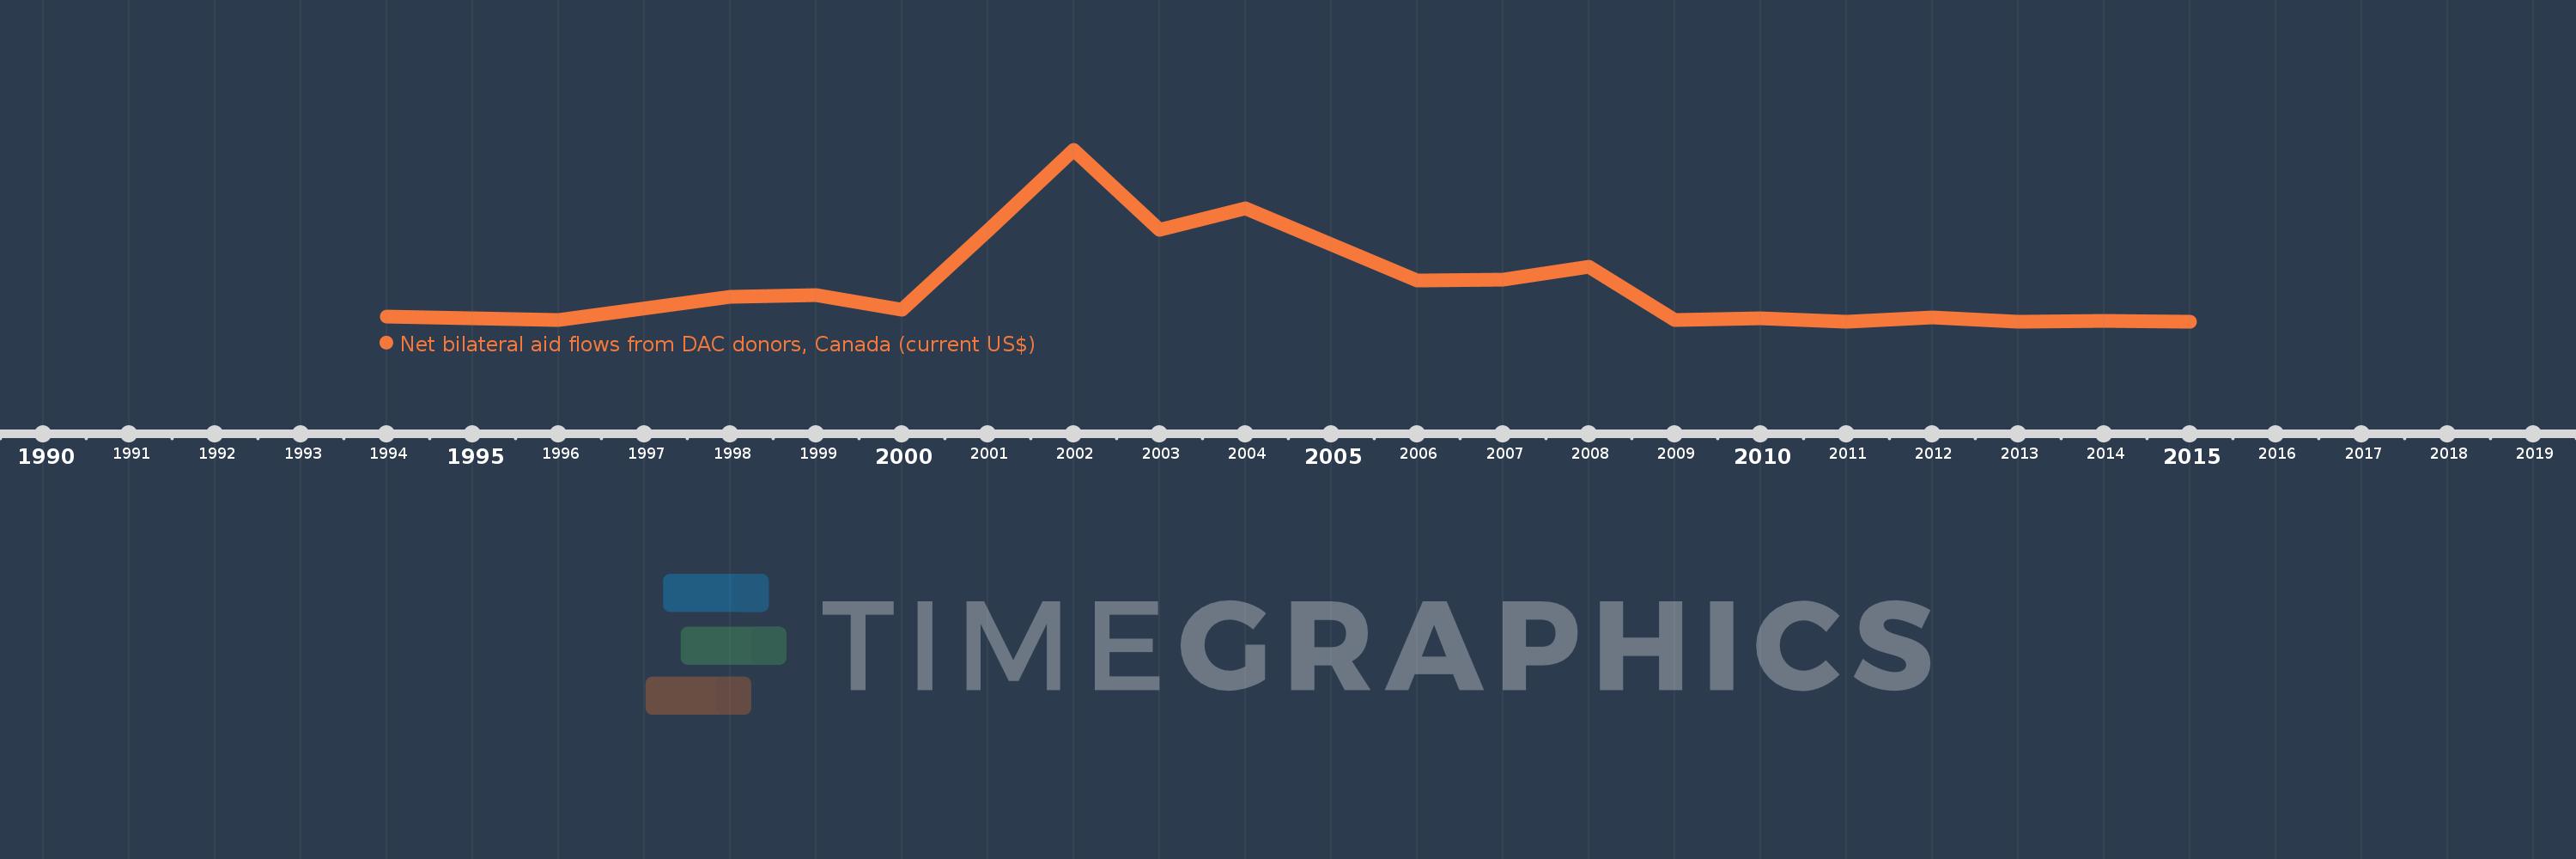
This timeline shows a graph from 1994 to 2015 of Albania. No data until 1993. Number of actual observations by date: 20.
Source name:
World Development Indicators
Source organization:
Development Assistance Committee of the Organisation for Economic Co-operation and Development, Geographical Distribution of Financial Flows to Developing Countries, Development Co-operation Report, and International Development Statistics database. Data are available online at: www.oecd.org/dac/stats/idsonline.
Categories, topics:
Aid Effectiveness
Last updated:
apr 23, 2017
Indicators value changes by year
Meaning:
563.0K
Minimum:
10.0K
jan 1, 2011
Maximum:
2.48 mln
jan 1, 2002
At the date of observation
Value
Absolute change
Change from the previous value
jan 1, 1994
90.0K
+90.0K
0.0%
jan 1, 1996
40.0K
-50.0K
-55.56%
jan 1, 1998
370.0K
+330.0K
825.0%
jan 1, 1999
400.0K
+30.0K
8.11%
jan 1, 2000
190.0K
-210.0K
-52.5%
jan 1, 2001
1.32 mln
+1.13 mln
594.74%
jan 1, 2002
2.48 mln
+1.16 mln
87.88%
jan 1, 2003
1.34 mln
-1.14 mln
-45.97%
jan 1, 2004
1.65 mln
+310.0K
23.13%
jan 1, 2005
1.12 mln
-530.0K
-32.12%
jan 1, 2006
610.0K
-510.0K
-45.54%
jan 1, 2007
620.0K
+10.0K
1.64%
jan 1, 2008
800.0K
+180.0K
29.03%
jan 1, 2009
40.0K
-760.0K
-95.0%
jan 1, 2010
60.0K
+20.0K
50.0%
jan 1, 2011
10.0K
-50.0K
-83.33%
jan 1, 2012
70.0K
+60.0K
600.0%
jan 1, 2013
10.0K
-60.0K
-85.71%
jan 1, 2014
30.0K
+20.0K
200.0%
jan 1, 2015
10.0K
-20.0K
-66.67%
Ranking of countries by current statistics by years