33
/
AIzaSyB4mHJ5NPEv-XzF7P6NDYXjlkCWaeKw5bc
November 30, 2025
160778
Israel
ISR
true
2
1
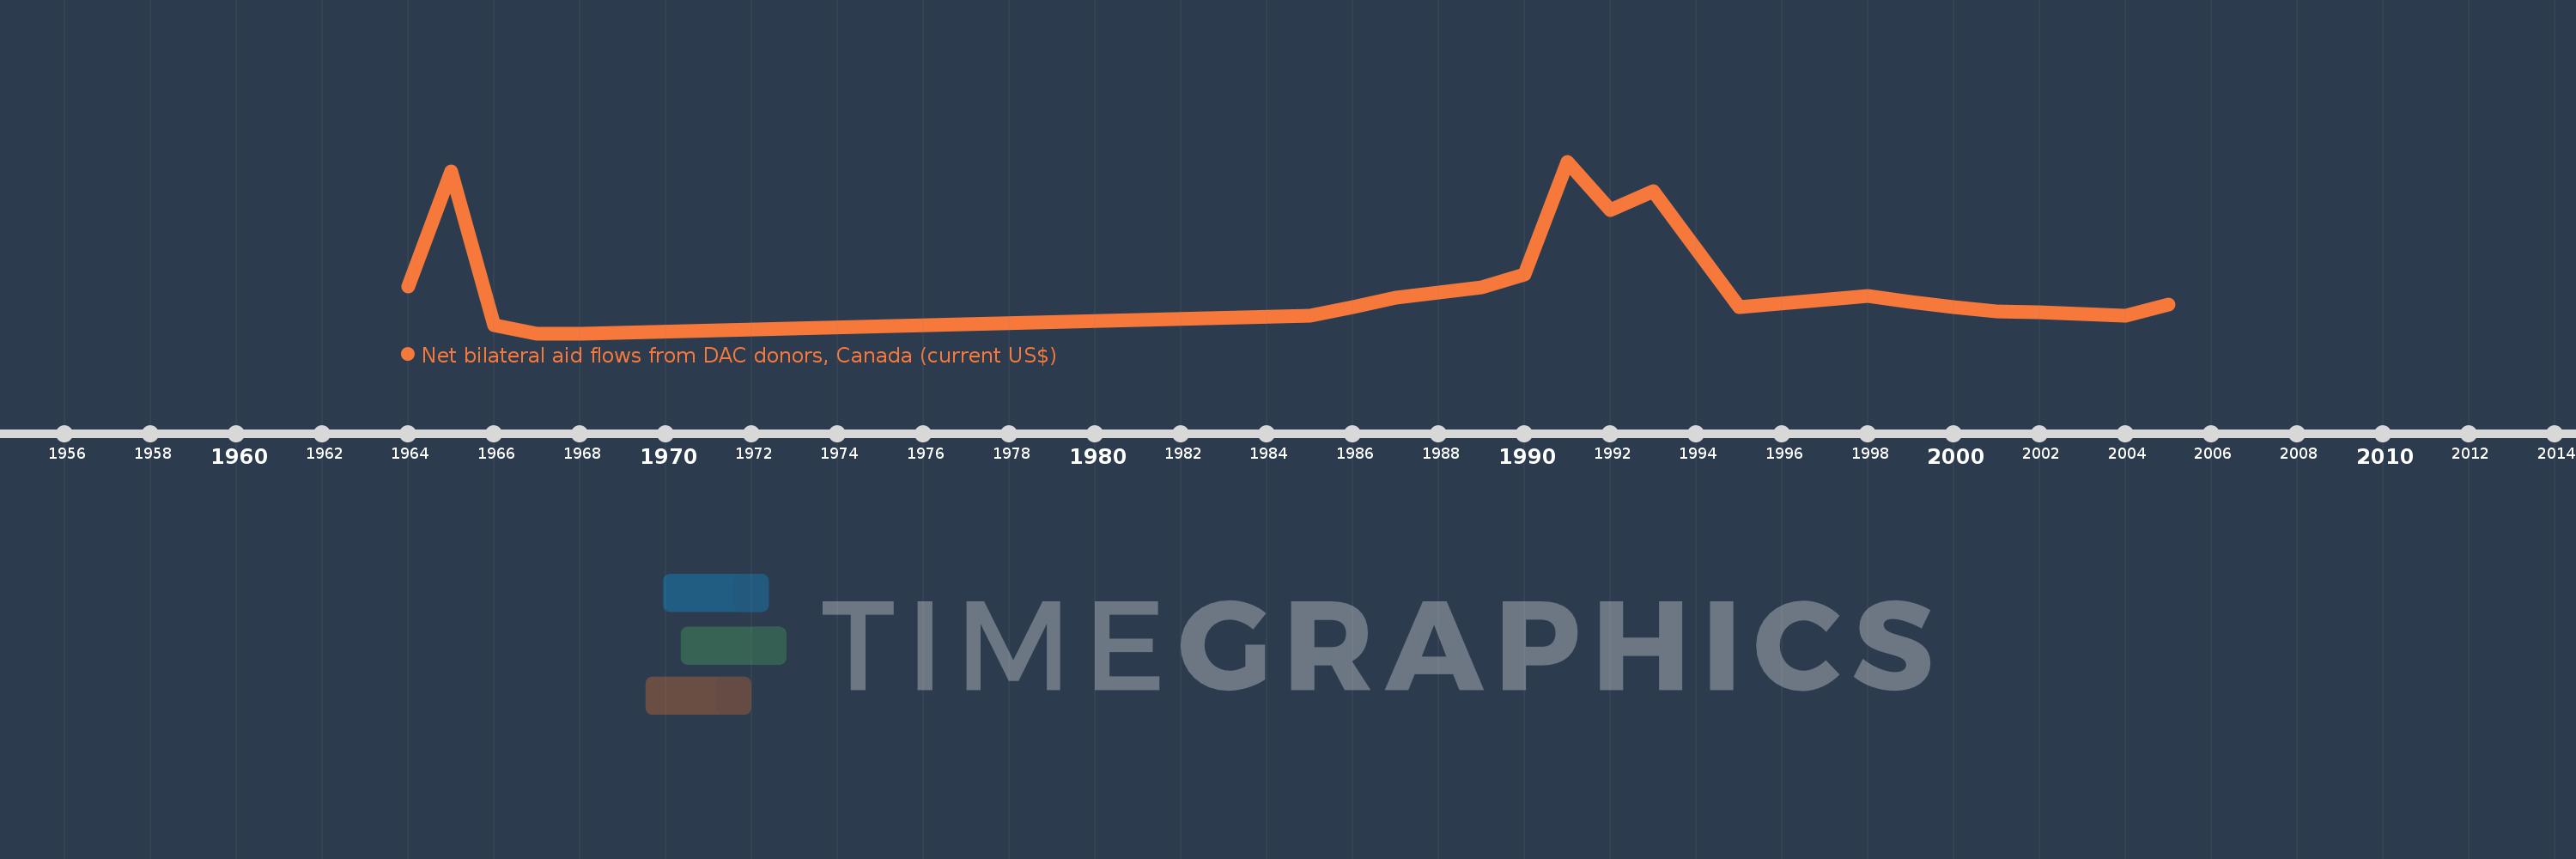
Net bilateral aid flows from DAC donors, Canada (current US$)
2005,2004,2002,2001,2000,1999,1998,1995,1993,1992,1991,1990,1989,1988,1987,1986,1985,1968,1967,1966,1965,1964