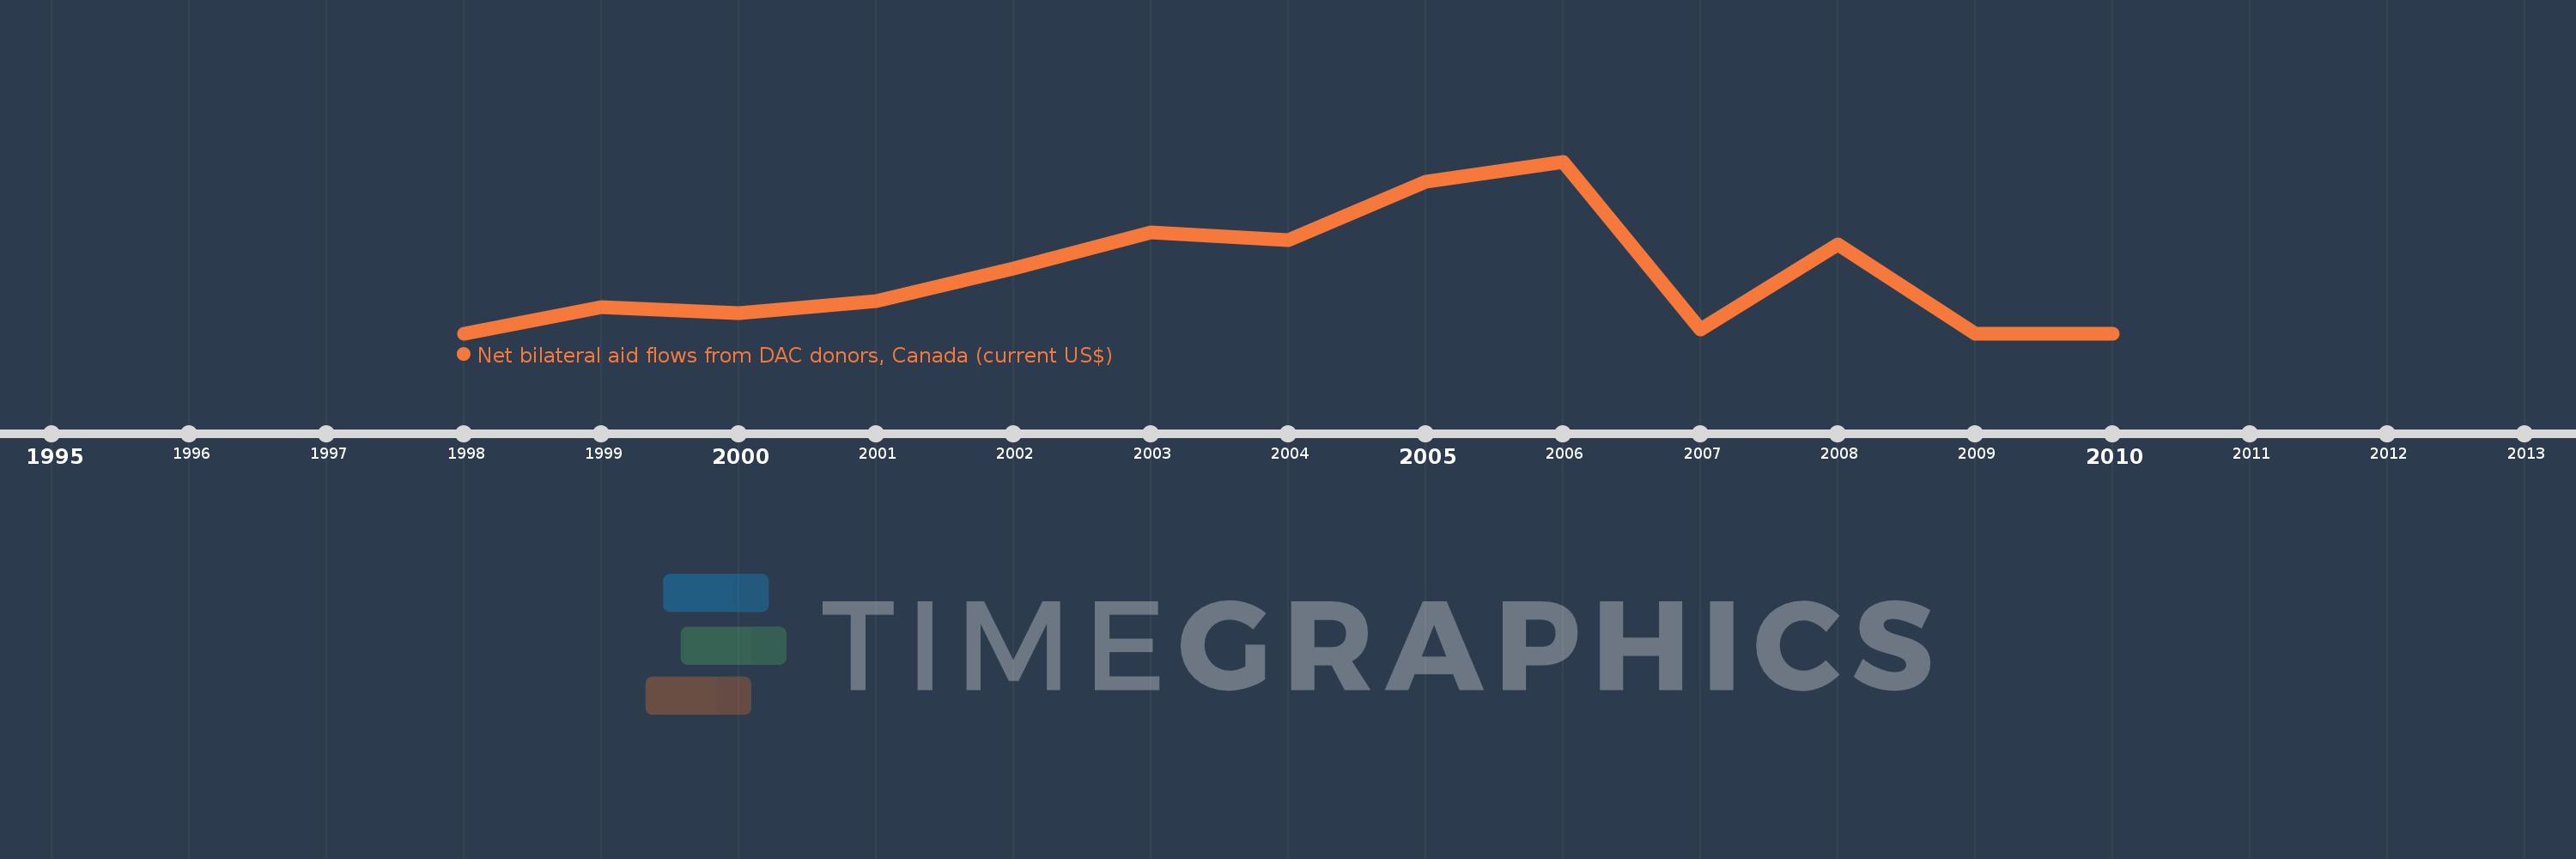
This timeline shows a graph from 1998 to 2010 of Uzbekistan. No data until 1997. Number of actual observations by date: 13.
Source name:
World Development Indicators
Source organization:
Development Assistance Committee of the Organisation for Economic Co-operation and Development, Geographical Distribution of Financial Flows to Developing Countries, Development Co-operation Report, and International Development Statistics database. Data are available online at: www.oecd.org/dac/stats/idsonline.
Categories, topics:
Aid Effectiveness
Last updated:
apr 23, 2017
Indicators value changes by year
Meaning:
296.923K
Minimum:
10.0K
jan 1, 1998
Maximum:
860.0K
jan 1, 2006
At the date of observation
Value
Absolute change
Change from the previous value
jan 1, 1998
10.0K
+10.0K
0.0%
jan 1, 1999
140.0K
+130.0K
1.3K%
jan 1, 2000
110.0K
-30.0K
-21.43%
jan 1, 2001
170.0K
+60.0K
54.55%
jan 1, 2002
330.0K
+160.0K
94.12%
jan 1, 2003
510.0K
+180.0K
54.55%
jan 1, 2004
470.0K
-40.0K
-7.84%
jan 1, 2005
760.0K
+290.0K
61.7%
jan 1, 2006
860.0K
+100.0K
13.16%
jan 1, 2007
30.0K
-830.0K
-96.51%
jan 1, 2008
450.0K
+420.0K
1.4K%
jan 1, 2009
10.0K
-440.0K
-97.78%
jan 1, 2010
10.0K
0.0
0.0%
Ranking of countries by current statistics by years