33
/
AIzaSyB4mHJ5NPEv-XzF7P6NDYXjlkCWaeKw5bc
November 30, 2025
232477
Samoa
WSM
true
2
1
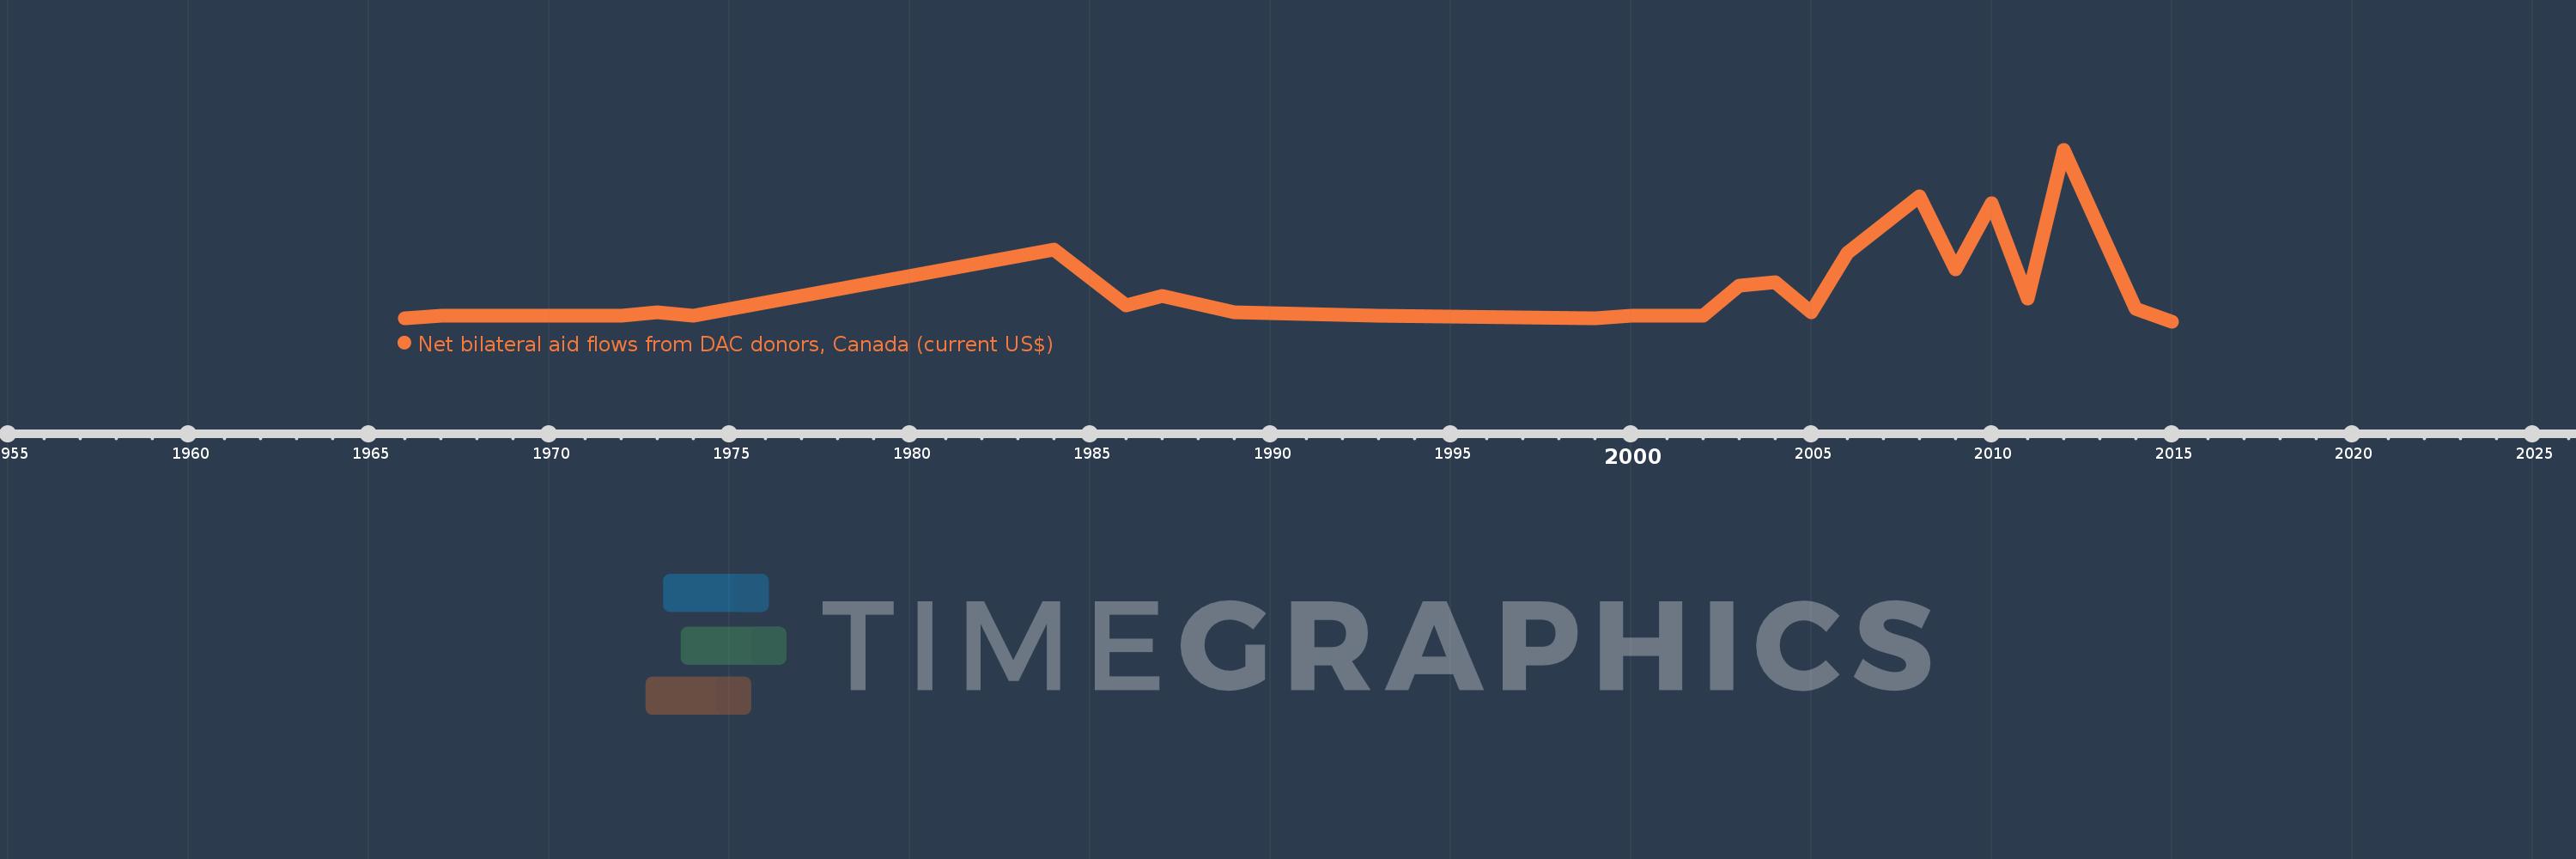
Net bilateral aid flows from DAC donors, Canada (current US$)
2015,2014,2012,2011,2010,2009,2008,2006,2005,2004,2003,2002,2001,2000,1999,1993,1989,1987,1986,1984,1974,1973,1972,1969,1968,1967,1966