33
/
AIzaSyB4mHJ5NPEv-XzF7P6NDYXjlkCWaeKw5bc
November 30, 2025
151832
Hong Kong SAR, China
HKG
true
2
1
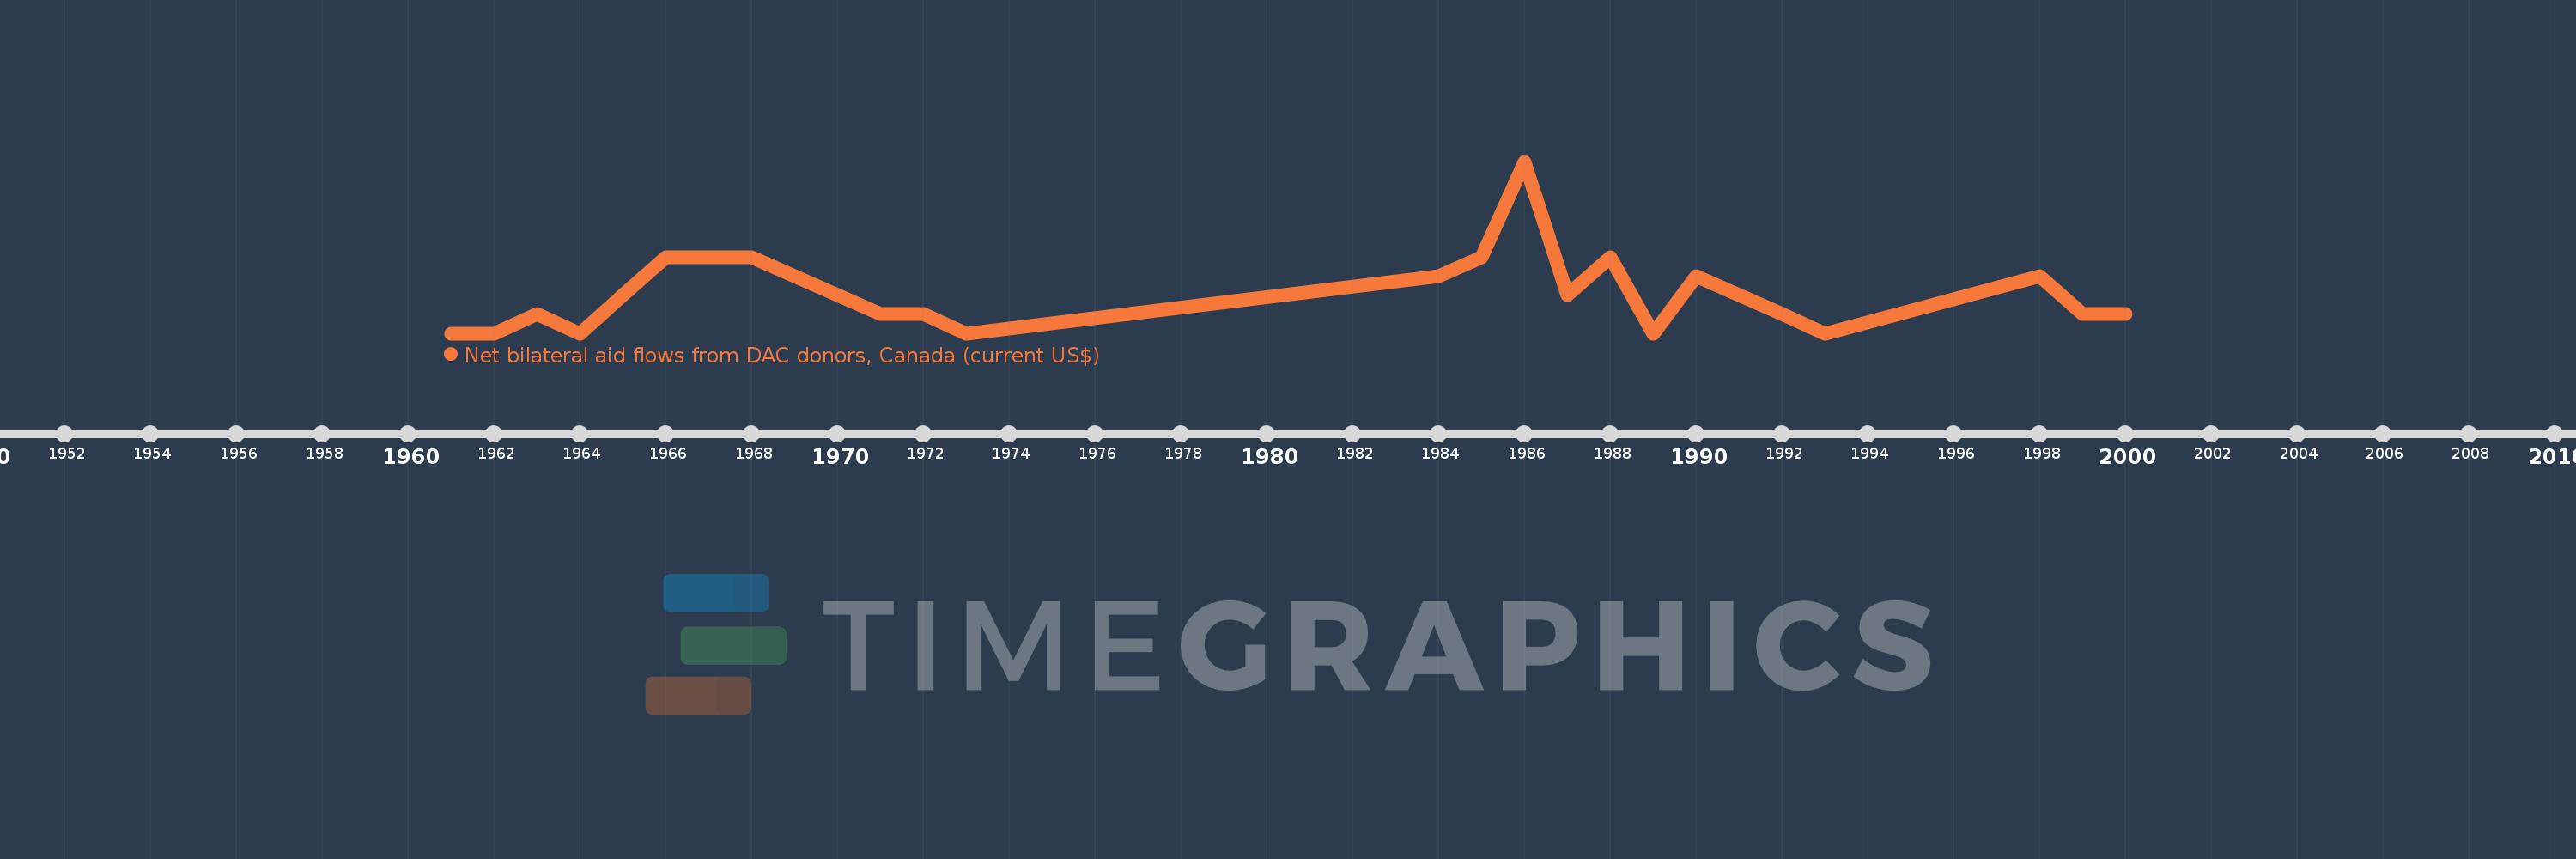
Net bilateral aid flows from DAC donors, Canada (current US$)
2000,1999,1998,1993,1992,1990,1989,1988,1987,1986,1985,1984,1973,1972,1971,1970,1969,1968,1967,1966,1965,1964,1963,1962,1961