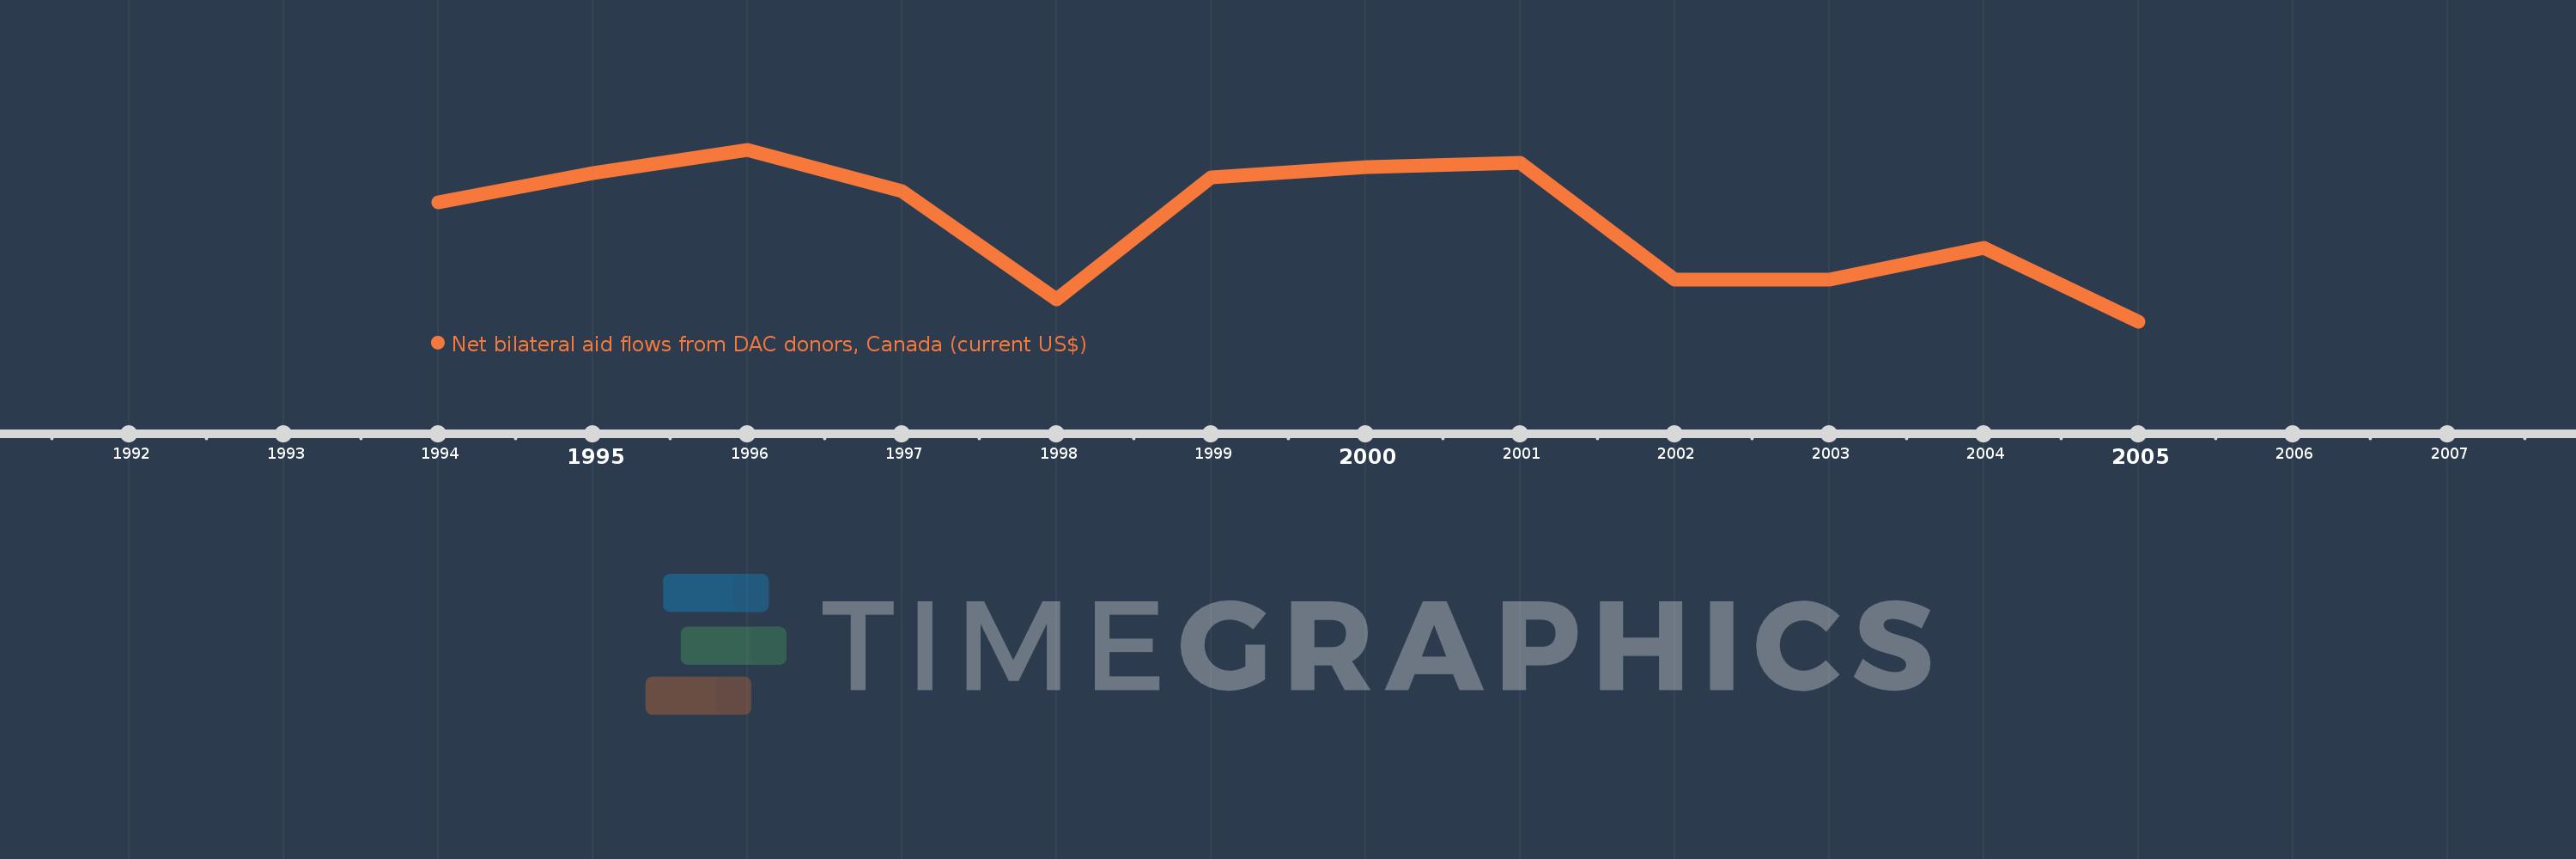
This timeline shows a graph from 1994 to 2005 of Latvia. No data until 1993. Number of actual observations by date: 12.
Source name:
World Development Indicators
Source organization:
Development Assistance Committee of the Organisation for Economic Co-operation and Development, Geographical Distribution of Financial Flows to Developing Countries, Development Co-operation Report, and International Development Statistics database. Data are available online at: www.oecd.org/dac/stats/idsonline.
Categories, topics:
Aid Effectiveness
Last updated:
apr 23, 2017
Indicators value changes by year
Meaning:
940.833K
Minimum:
230.0K
jan 1, 2005
Maximum:
1.44 mln
jan 1, 1996
At the date of observation
Value
Absolute change
Change from the previous value
jan 1, 1994
1.07 mln
+1.07 mln
0.0%
jan 1, 1995
1.28 mln
+210.0K
19.63%
jan 1, 1996
1.44 mln
+160.0K
12.5%
jan 1, 1997
1.15 mln
-290.0K
-20.14%
jan 1, 1998
390.0K
-760.0K
-66.09%
jan 1, 1999
1.25 mln
+860.0K
220.51%
jan 1, 2000
1.32 mln
+70.0K
5.6%
jan 1, 2001
1.35 mln
+30.0K
2.27%
jan 1, 2002
530.0K
-820.0K
-60.74%
jan 1, 2003
530.0K
0.0
0.0%
jan 1, 2004
750.0K
+220.0K
41.51%
jan 1, 2005
230.0K
-520.0K
-69.33%
Ranking of countries by current statistics by years