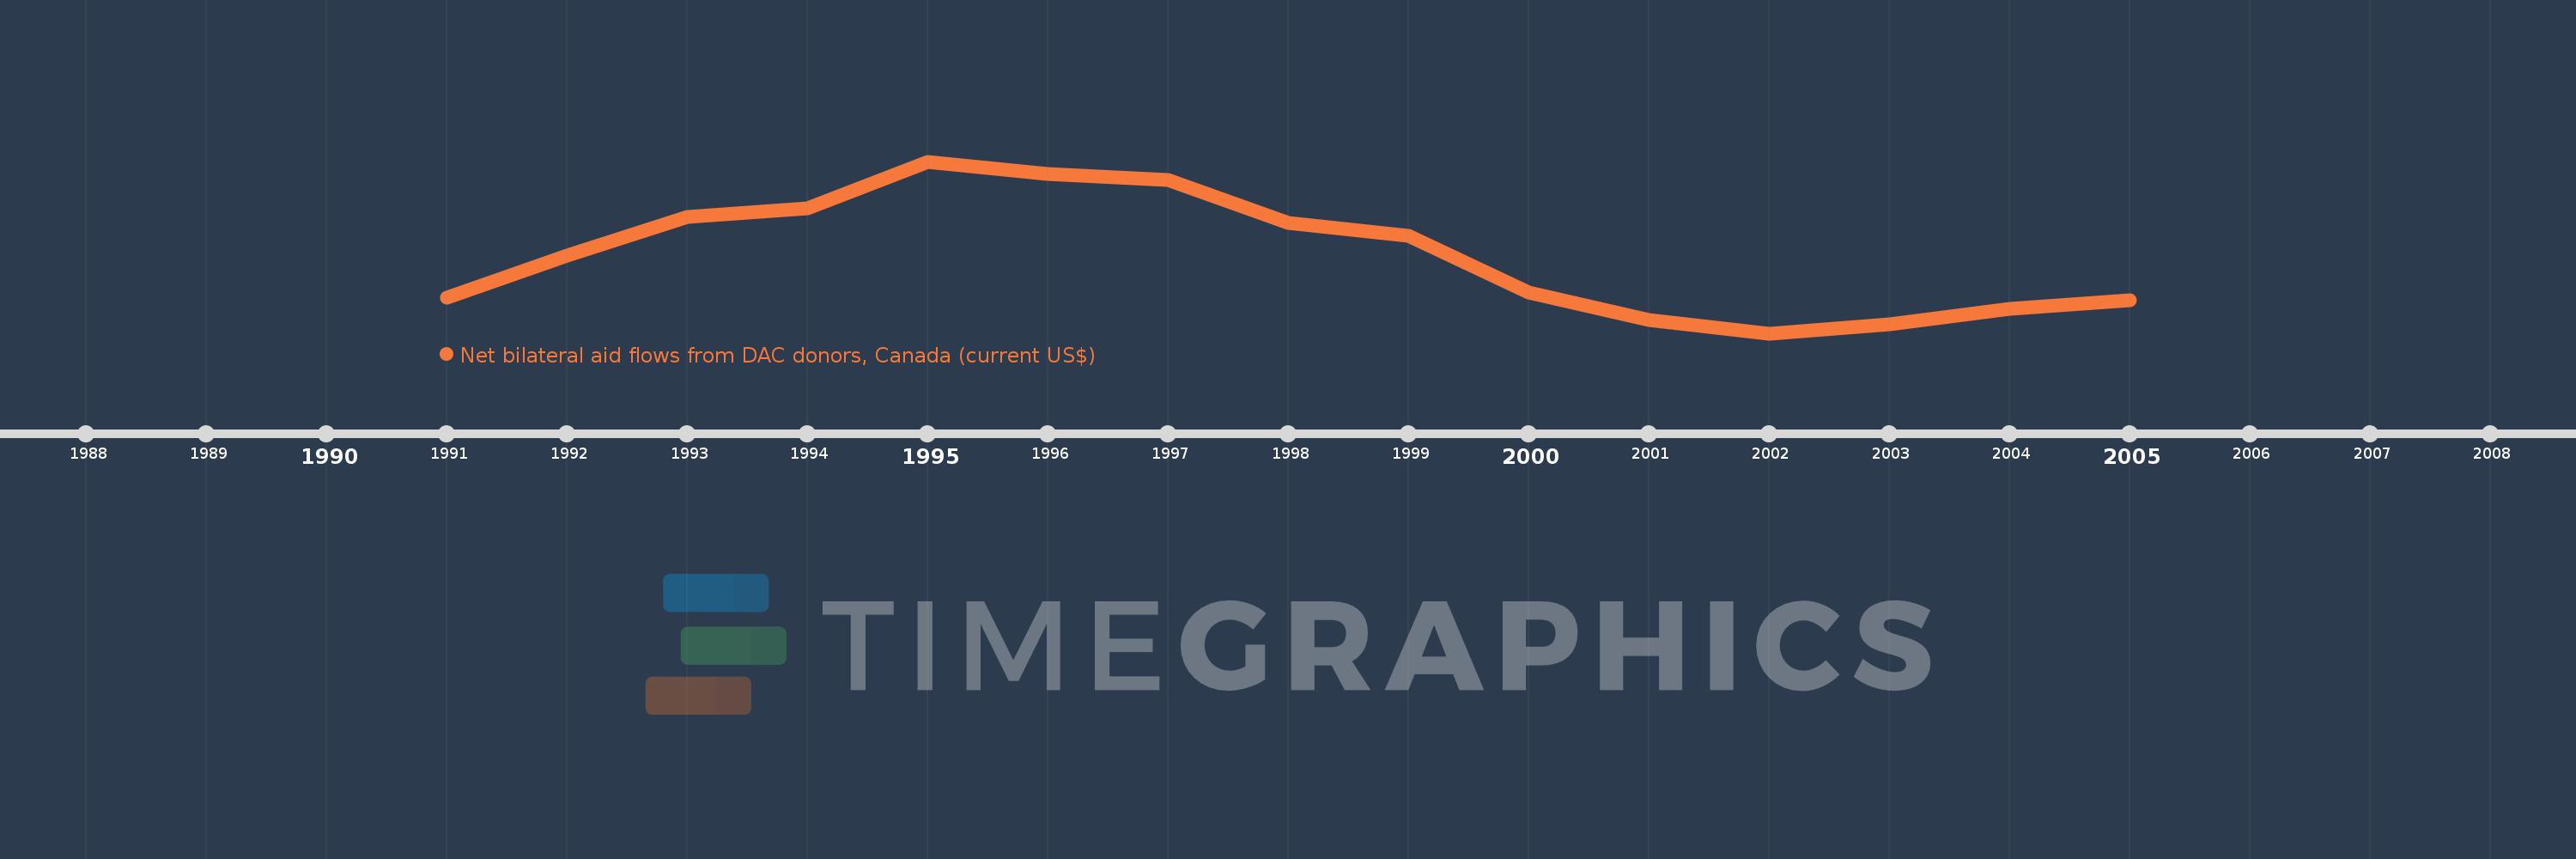
This timeline shows a graph from 1991 to 2005 of Hungary. No data until 1990. Number of actual observations by date: 15.
Source name:
World Development Indicators
Source organization:
Development Assistance Committee of the Organisation for Economic Co-operation and Development, Geographical Distribution of Financial Flows to Developing Countries, Development Co-operation Report, and International Development Statistics database. Data are available online at: www.oecd.org/dac/stats/idsonline.
Categories, topics:
Aid Effectiveness
Last updated:
apr 23, 2017
Indicators value changes by year
Meaning:
1.446 mln
Minimum:
250.0K
jan 1, 2002
Maximum:
2.89 mln
jan 1, 1995
At the date of observation
Value
Absolute change
Change from the previous value
jan 1, 1991
800.0K
+800.0K
0.0%
jan 1, 1992
1.44 mln
+640.0K
80.0%
jan 1, 1993
2.04 mln
+600.0K
41.67%
jan 1, 1994
2.17 mln
+130.0K
6.37%
jan 1, 1995
2.89 mln
+720.0K
33.18%
jan 1, 1996
2.7 mln
-190.0K
-6.57%
jan 1, 1997
2.6 mln
-100.0K
-3.7%
jan 1, 1998
1.94 mln
-660.0K
-25.38%
jan 1, 1999
1.75 mln
-190.0K
-9.79%
jan 1, 2000
880.0K
-870.0K
-49.71%
jan 1, 2001
460.0K
-420.0K
-47.73%
jan 1, 2002
250.0K
-210.0K
-45.65%
jan 1, 2003
390.0K
+140.0K
56.0%
jan 1, 2004
620.0K
+230.0K
58.97%
jan 1, 2005
760.0K
+140.0K
22.58%
Ranking of countries by current statistics by years