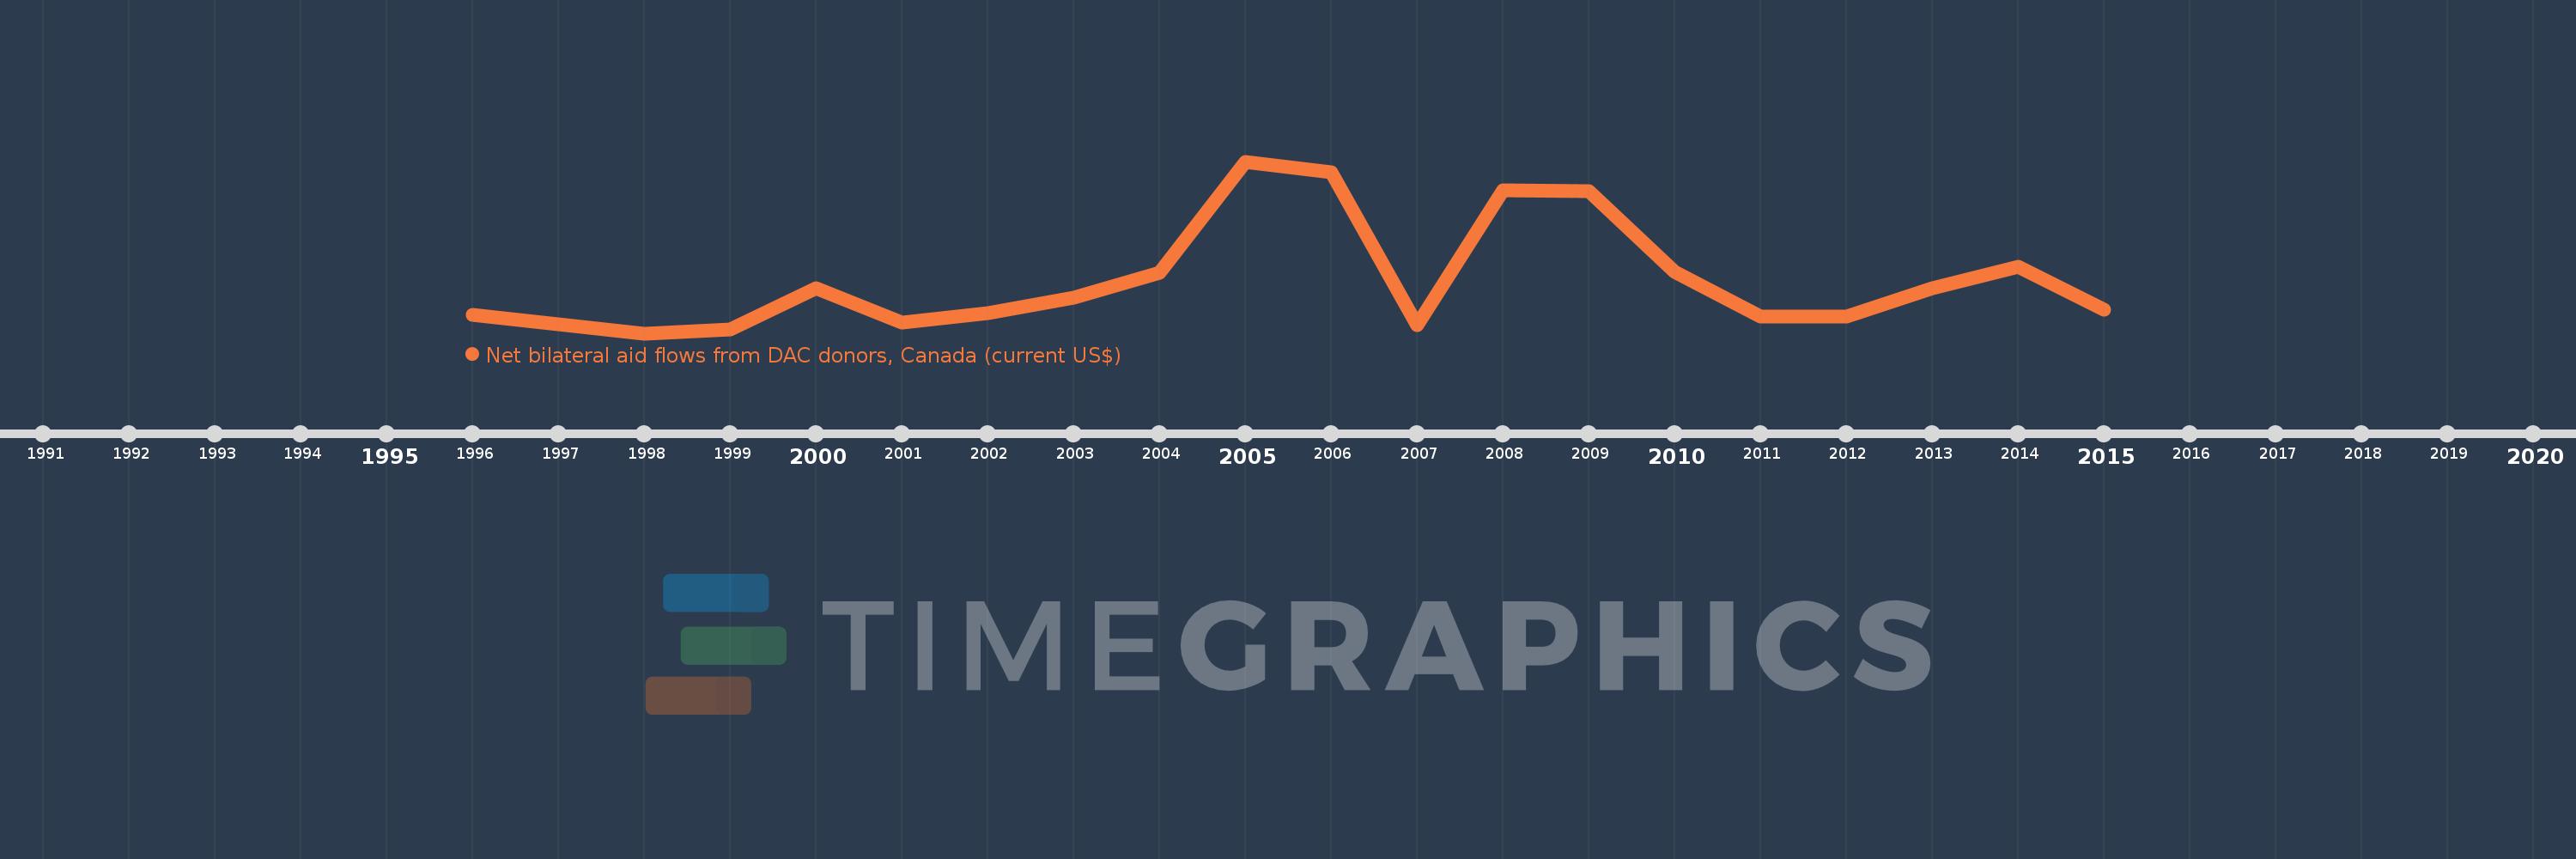
This timeline shows a graph from 1996 to 2015 of Tajikistan. No data until 1995. Number of actual observations by date: 19.
Source name:
World Development Indicators
Source organization:
Development Assistance Committee of the Organisation for Economic Co-operation and Development, Geographical Distribution of Financial Flows to Developing Countries, Development Co-operation Report, and International Development Statistics database. Data are available online at: www.oecd.org/dac/stats/idsonline.
Categories, topics:
Aid Effectiveness
Last updated:
apr 23, 2017
Indicators value changes by year
Meaning:
2.238 mln
Minimum:
10.0K
jan 1, 1998
Maximum:
6.93 mln
jan 1, 2005
At the date of observation
Value
Absolute change
Change from the previous value
jan 1, 1996
750.0K
+750.0K
0.0%
jan 1, 1998
10.0K
-740.0K
-98.67%
jan 1, 1999
150.0K
+140.0K
1.4K%
jan 1, 2000
1.81 mln
+1.66 mln
1.11K%
jan 1, 2001
440.0K
-1.37 mln
-75.69%
jan 1, 2002
820.0K
+380.0K
86.36%
jan 1, 2003
1.46 mln
+640.0K
78.05%
jan 1, 2004
2.46 mln
+1000.0K
68.49%
jan 1, 2005
6.93 mln
+4.47 mln
181.71%
jan 1, 2006
6.51 mln
-420.0K
-6.06%
jan 1, 2007
350.0K
-6.16 mln
-94.62%
jan 1, 2008
5.76 mln
+5.41 mln
1.55K%
jan 1, 2009
5.74 mln
-20.0K
-0.35%
jan 1, 2010
2.48 mln
-3.26 mln
-56.79%
jan 1, 2011
700.0K
-1.78 mln
-71.77%
jan 1, 2012
670.0K
-30.0K
-4.29%
jan 1, 2013
1.82 mln
+1.15 mln
171.64%
jan 1, 2014
2.7 mln
+880.0K
48.35%
jan 1, 2015
960.0K
-1.74 mln
-64.44%
Ranking of countries by current statistics by years