Download This statistics in other country:
Timeline:
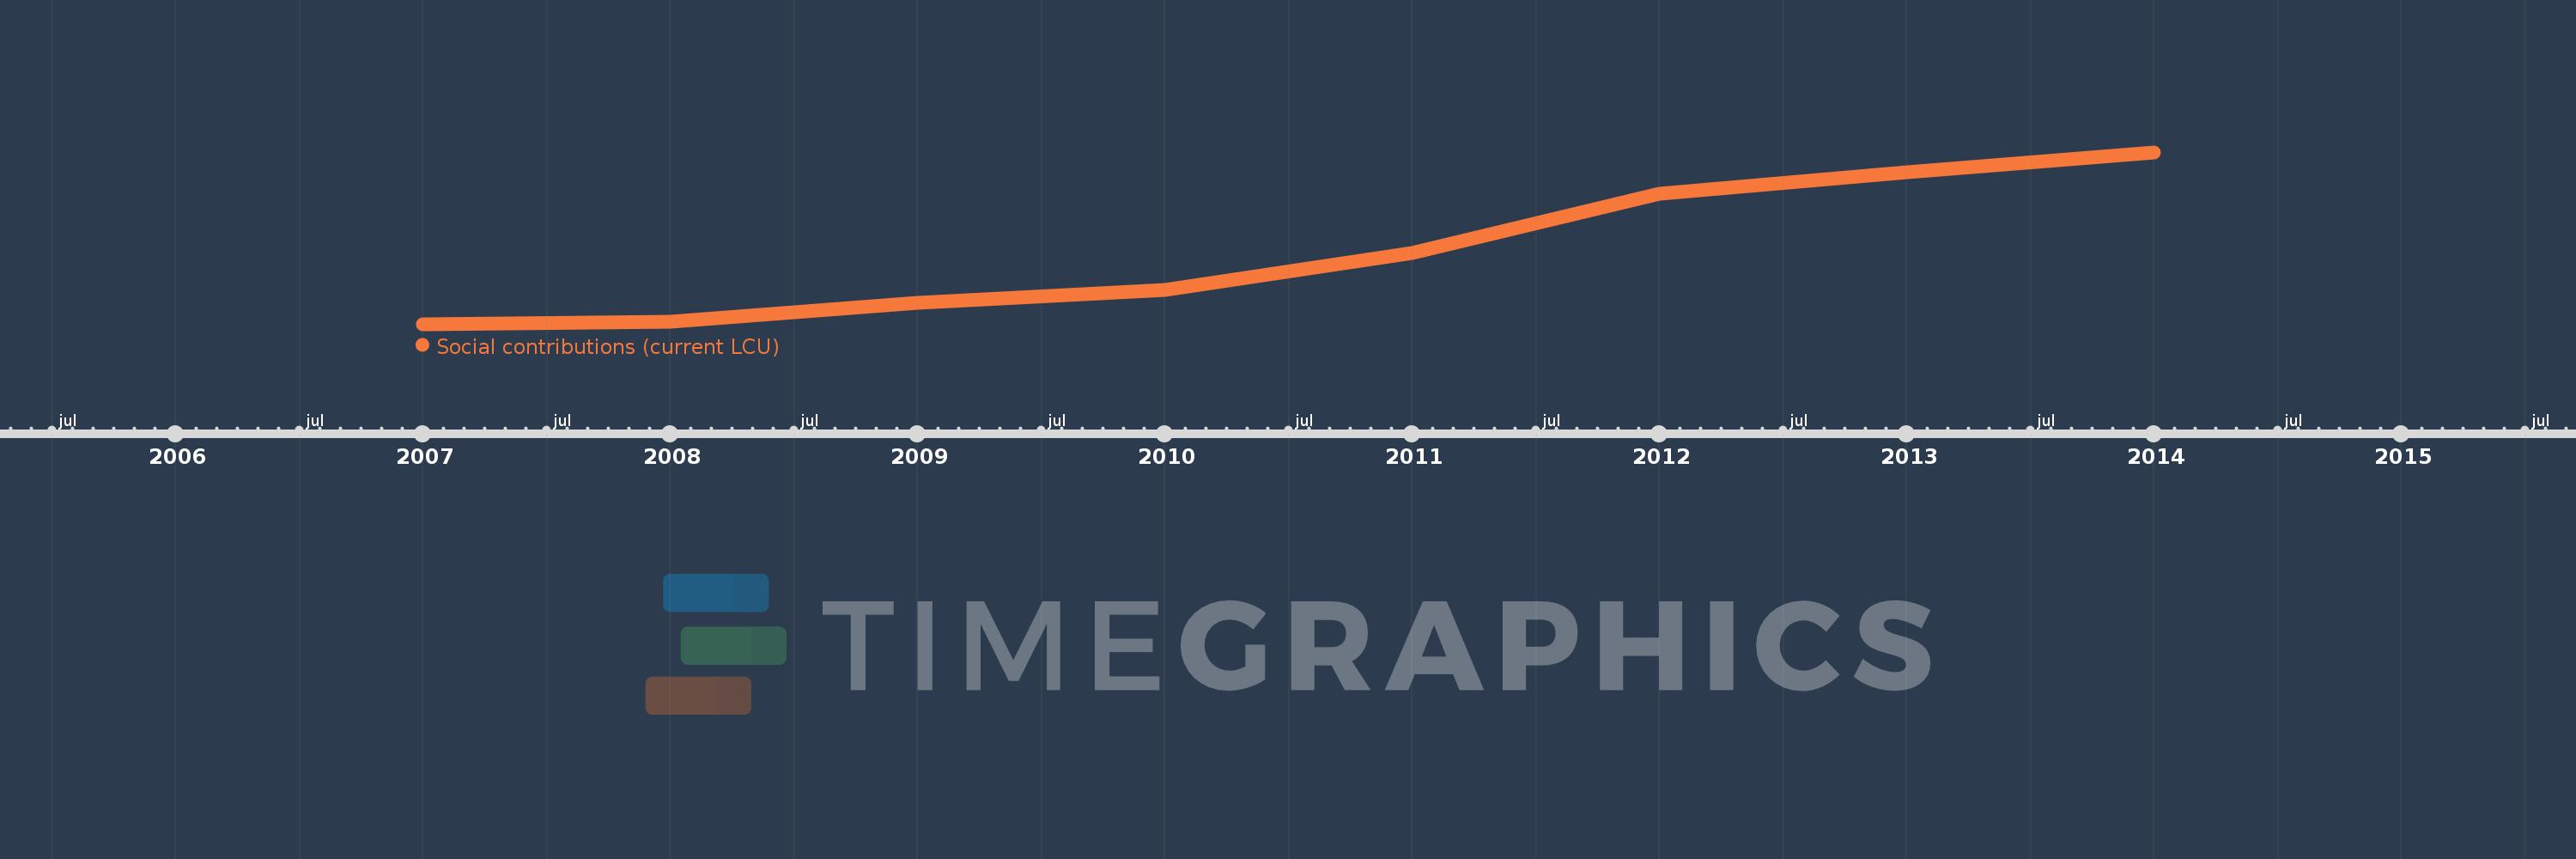
This timeline shows a graph from 2007 to 2014 of Afghanistan. No data until 2006. Number of actual observations by date: 8.
Source name:
World Development Indicators
Source organization:
International Monetary Fund, Government Finance Statistics Yearbook and data files.
Categories, topics:
Public Sector
Last updated:
apr 23, 2017
Indicators value changes by year
Minimum:
357.352 mln
jan 1, 2007
Maximum:
3.478 bln
jan 1, 2014
At the date of observation
Value
Absolute change
Change from the previous value
jan 1, 2007
357.352 mln
+357.352 mln
0.0%
jan 1, 2008
398.466 mln
+41.114 mln
11.51%
jan 1, 2009
751.98 mln
+353.514 mln
88.72%
jan 1, 2010
974.448 mln
+222.467 mln
29.58%
jan 1, 2011
1.65 bln
+676.013 mln
69.37%
jan 1, 2012
2.735 bln
+1.085 bln
65.74%
jan 1, 2013
3.119 bln
+383.159 mln
14.01%
jan 1, 2014
3.478 bln
+359.778 mln
11.54%
Ranking of countries by current statistics by years