Download This statistics in other country:
Timeline:
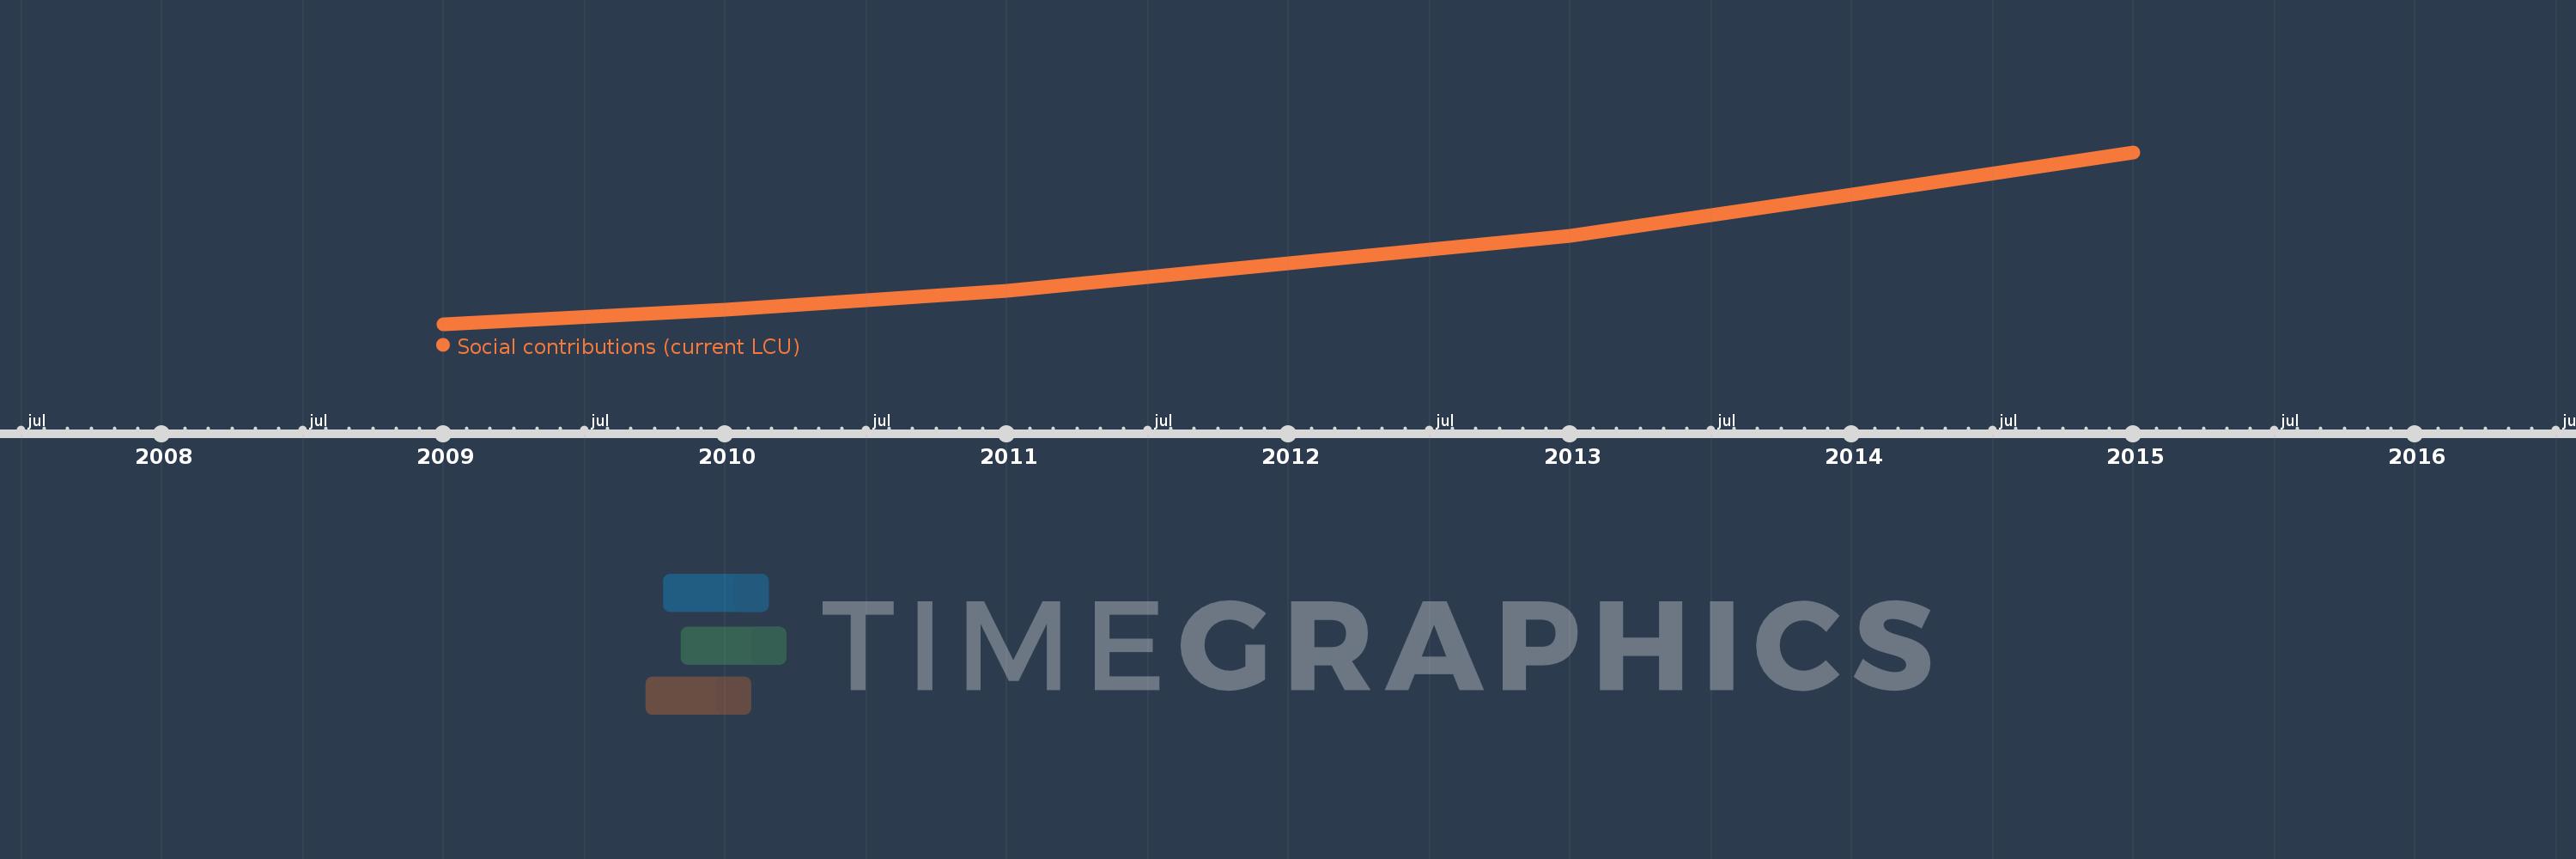
This timeline shows a graph from 2009 to 2015 of Turkey. No data until 2008. Number of actual observations by date: 7.
Source name:
World Development Indicators
Source organization:
International Monetary Fund, Government Finance Statistics Yearbook and data files.
Categories, topics:
Public Sector
Last updated:
apr 23, 2017
Indicators value changes by year
Minimum:
82.201 bln
jan 1, 2009
Maximum:
183.758 bln
jan 1, 2015
At the date of observation
Value
Absolute change
Change from the previous value
jan 1, 2009
82.201 bln
+82.201 bln
0.0%
jan 1, 2010
90.97 bln
+8.769 bln
10.67%
jan 1, 2011
101.748 bln
+10.778 bln
11.85%
jan 1, 2012
118.067 bln
+16.319 bln
16.04%
jan 1, 2013
134.278 bln
+16.211 bln
13.73%
jan 1, 2014
158.826 bln
+24.548 bln
18.28%
jan 1, 2015
183.758 bln
+24.932 bln
15.7%
Ranking of countries by current statistics by years