Download This statistics in other country:
Timeline:
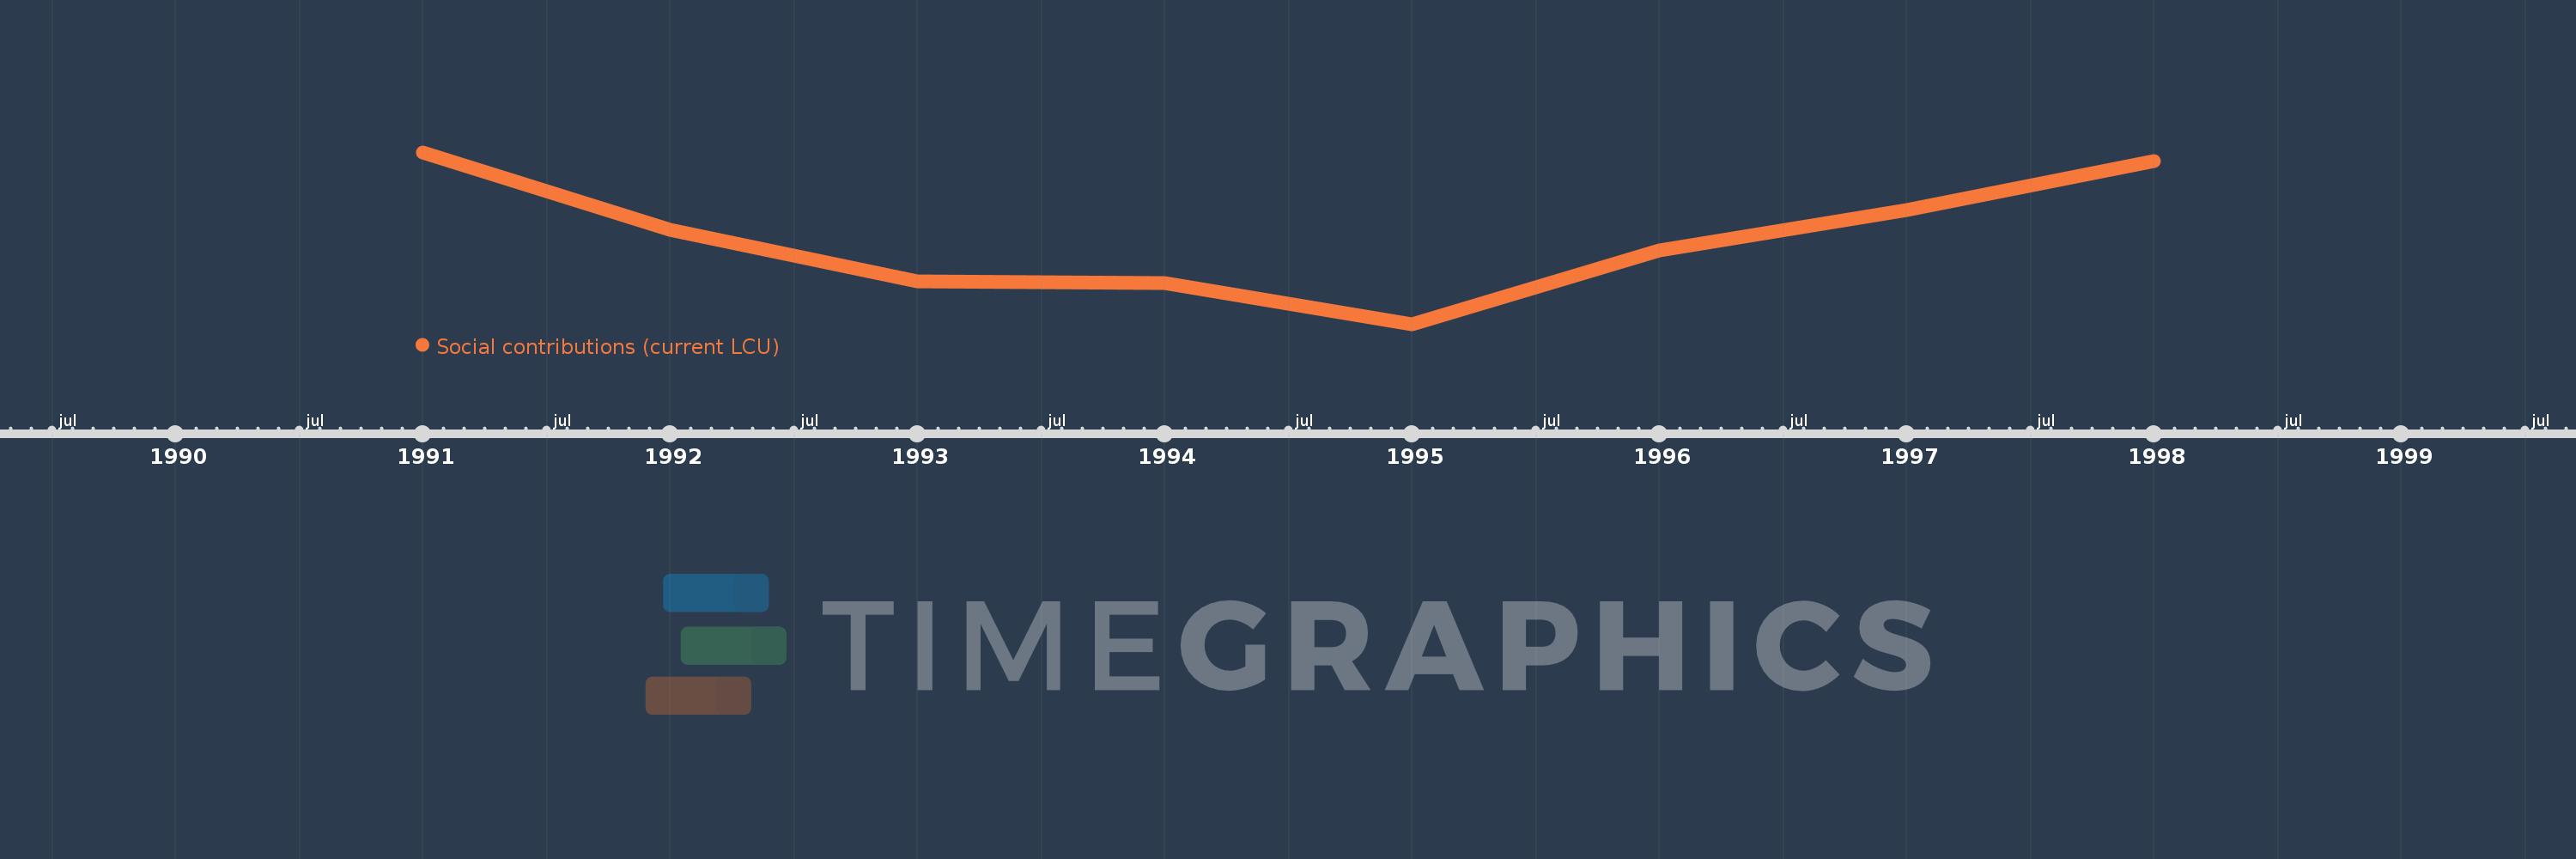
This timeline shows a graph from 1991 to 1998 of Zimbabwe. No data until 1990. Number of actual observations by date: 8.
Source name:
World Development Indicators
Source organization:
International Monetary Fund, Government Finance Statistics Yearbook and data files.
Categories, topics:
Public Sector
Last updated:
apr 23, 2017
Indicators value changes by year
Minimum:
37.583 mln
jan 1, 1995
Maximum:
70.985 mln
jan 1, 1991
At the date of observation
Value
Absolute change
Change from the previous value
jan 1, 1991
70.985 mln
+70.985 mln
0.0%
jan 1, 1992
55.951 mln
-15.034 mln
-21.18%
jan 1, 1993
45.976 mln
-9.975 mln
-17.83%
jan 1, 1994
45.612 mln
-363.793K
-0.79%
jan 1, 1995
37.583 mln
-8.029 mln
-17.6%
jan 1, 1996
51.954 mln
+14.371 mln
38.24%
jan 1, 1997
59.716 mln
+7.762 mln
14.94%
jan 1, 1998
69.275 mln
+9.559 mln
16.01%
Ranking of countries by current statistics by years