Download This statistics in other country:
Timeline:
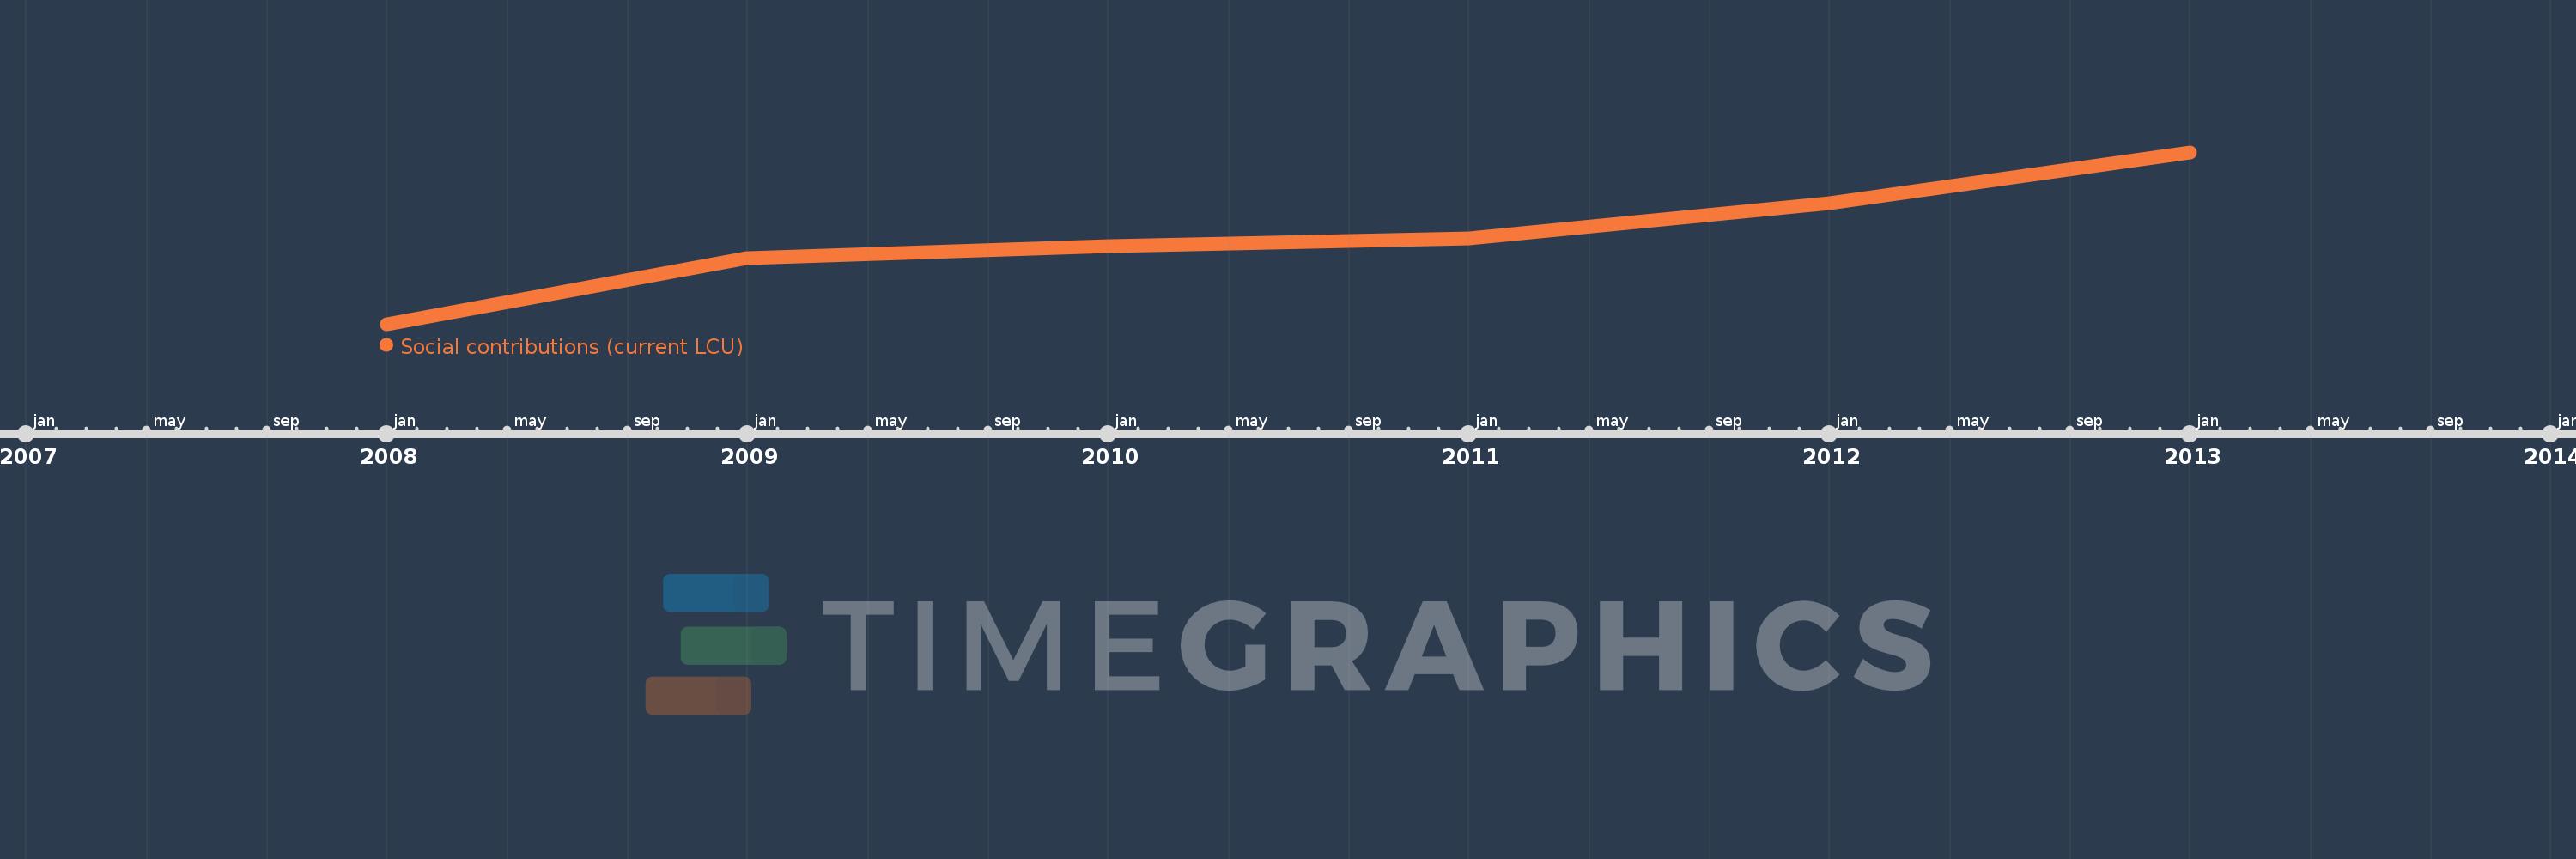
This timeline shows a graph from 2008 to 2013 of Serbia. No data until 2007. Number of actual observations by date: 6.
Source name:
World Development Indicators
Source organization:
International Monetary Fund, Government Finance Statistics Yearbook and data files.
Categories, topics:
Public Sector
Last updated:
apr 23, 2017
Indicators value changes by year
Minimum:
313.025 bln
jan 1, 2008
Maximum:
445.566 bln
jan 1, 2013
At the date of observation
Value
Absolute change
Change from the previous value
jan 1, 2008
313.025 bln
+313.025 bln
0.0%
jan 1, 2009
364.081 bln
+51.056 bln
16.31%
jan 1, 2010
373.073 bln
+8.992 bln
2.47%
jan 1, 2011
379.01 bln
+5.936 bln
1.59%
jan 1, 2012
406.706 bln
+27.697 bln
7.31%
jan 1, 2013
445.566 bln
+38.86 bln
9.55%
Ranking of countries by current statistics by years