33
/
AIzaSyB4mHJ5NPEv-XzF7P6NDYXjlkCWaeKw5bc
November 30, 2025
166874
Kazakhstan
KAZ
true
2
1
Social contributions (current LCU)
2016,2015,2014,2013,2012,2011,2000,1999,1998
Create a timeline
Public Timelines
For education
For educational institutions
For teachers
For students
Cabinet
For educational institutions
For teachers
For students
Open cabinet
FAQ
Close
Create a timeline
Public timelines
FAQ
About & Feedback
Terms
Privacy
FAQ
Support 24/7
Cabinet
Get premium
Donate
Download
Global statistics library
→
Kazakhstan
→
Social contributions (current LCU)
This statistics in other country:
Afghanistan
Albania
Angola
Argentina
Armenia
Australia
Austria
Azerbaijan
Barbados
Belarus
Belgium
Belize
Benin
Bhutan
Bolivia
Bosnia and Herzegovina
Brazil
Bulgaria
Burundi
Cabo Verde
Canada
Central African Republic
Chile
China
Colombia
Congo, Rep.
Costa Rica
Cote d'Ivoire
Croatia
Cyprus
Czech Republic
Denmark
Dominican Republic
Egypt, Arab Rep.
El Salvador
Estonia
Ethiopia
Fiji
Finland
France
Gambia, The
Georgia
Germany
Ghana
Greece
Grenada
Guatemala
Honduras
Hong Kong SAR, China
Hungary
Iceland
India
Indonesia
Iran, Islamic Rep.
Iraq
Ireland
Israel
Italy
Jamaica
Japan
Jordan
Kazakhstan
Kenya
Korea, Rep.
Latvia
Lebanon
Liberia
Lithuania
Luxembourg
Macao SAR, China
Macedonia, FYR
Madagascar
Malta
Mauritius
Mexico
Moldova
Mongolia
Morocco
Mozambique
Namibia
Netherlands
New Zealand
Norway
Panama
Papua New Guinea
Paraguay
Peru
Poland
Portugal
Romania
Russian Federation
San Marino
Sao Tome and Principe
Serbia
Seychelles
Slovak Republic
Slovenia
South Africa
Spain
Sri Lanka
St. Kitts and Nevis
Sweden
Switzerland
Syrian Arab Republic
Tajikistan
Thailand
Trinidad and Tobago
Tunisia
Turkey
Ukraine
United Arab Emirates
United Kingdom
United States
Uruguay
Venezuela, RB
Zambia
Zimbabwe
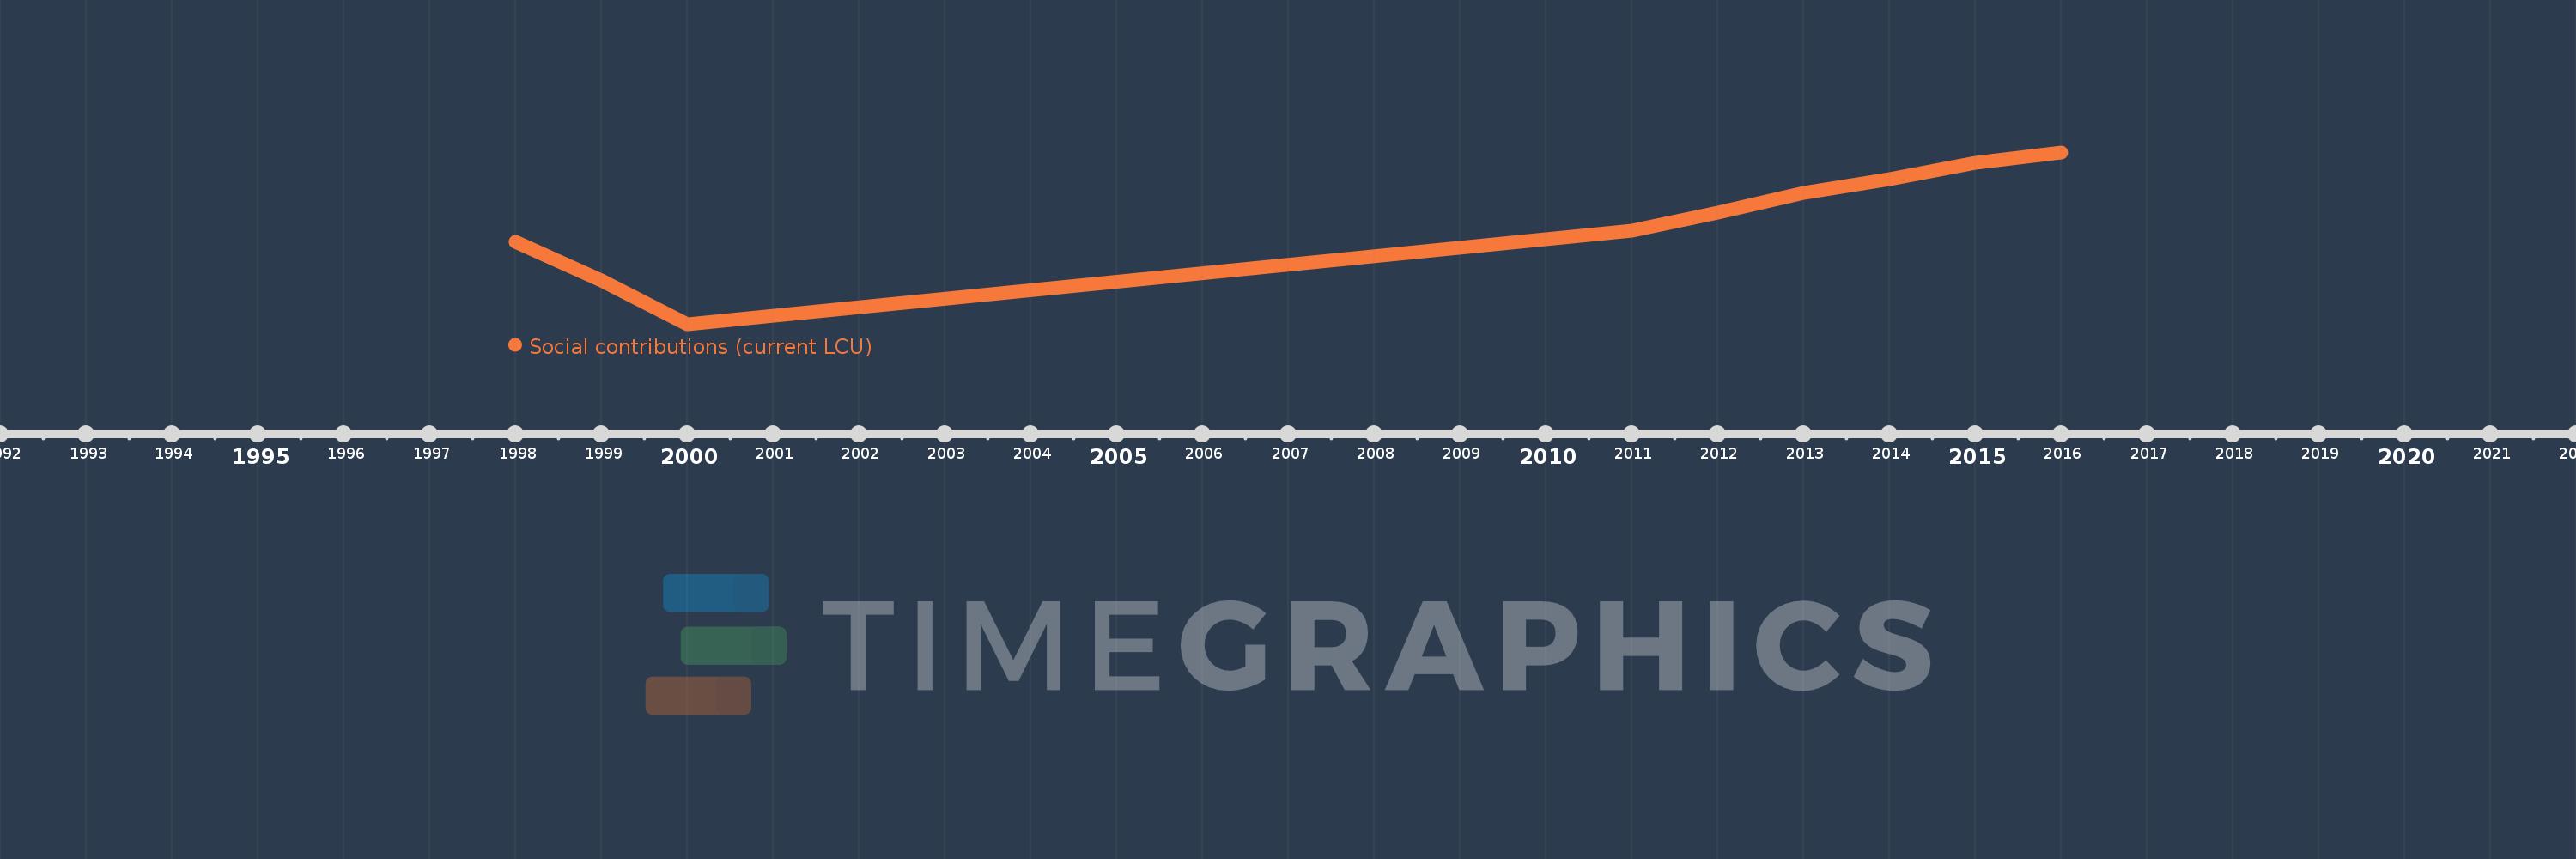
Timeline:
This timeline shows a graph from
1998
to
2016
of Kazakhstan. No data until
1997
. Number of actual observations by date:
9
.
Source name:
World Development Indicators
Source organization:
International Monetary Fund, Government Finance Statistics Yearbook and data files.
Categories, topics:
Public Sector
Last updated:
apr 23, 2017
Indicators value changes by year
Meaning:
146.517 bln
Minimum:
385.0 mln
jan 1, 2000
Maximum:
240.59 bln
jan 1, 2016
At the date of observation
Value
Absolute change
Change from the previous value
jan 1, 1998
116.075 bln
+116.075 bln
0.0%
jan 1, 1999
61.587 bln
-54.488 bln
-46.94%
jan 1, 2000
385.0 mln
-61.202 bln
-99.37%
jan 1, 2011
131.039 bln
+130.654 bln
33.94K%
jan 1, 2012
156.534 bln
+25.495 bln
19.46%
jan 1, 2013
183.73 bln
+27.196 bln
17.37%
jan 1, 2014
203.244 bln
+19.514 bln
10.62%
jan 1, 2015
225.466 bln
+22.222 bln
10.93%
jan 1, 2016
240.59 bln
+15.124 bln
6.71%
Ranking of countries by current statistics by years
About & Feedback
Terms
Privacy
FAQ
Support 24/7
Cabinet
Get premium
Donate
The service accepts bank transfer (ACH, Wire) or cards (Visa, MasterCard, etc). Processed by Stripe.
Secured with SSL