Download This statistics in other country:
Timeline:
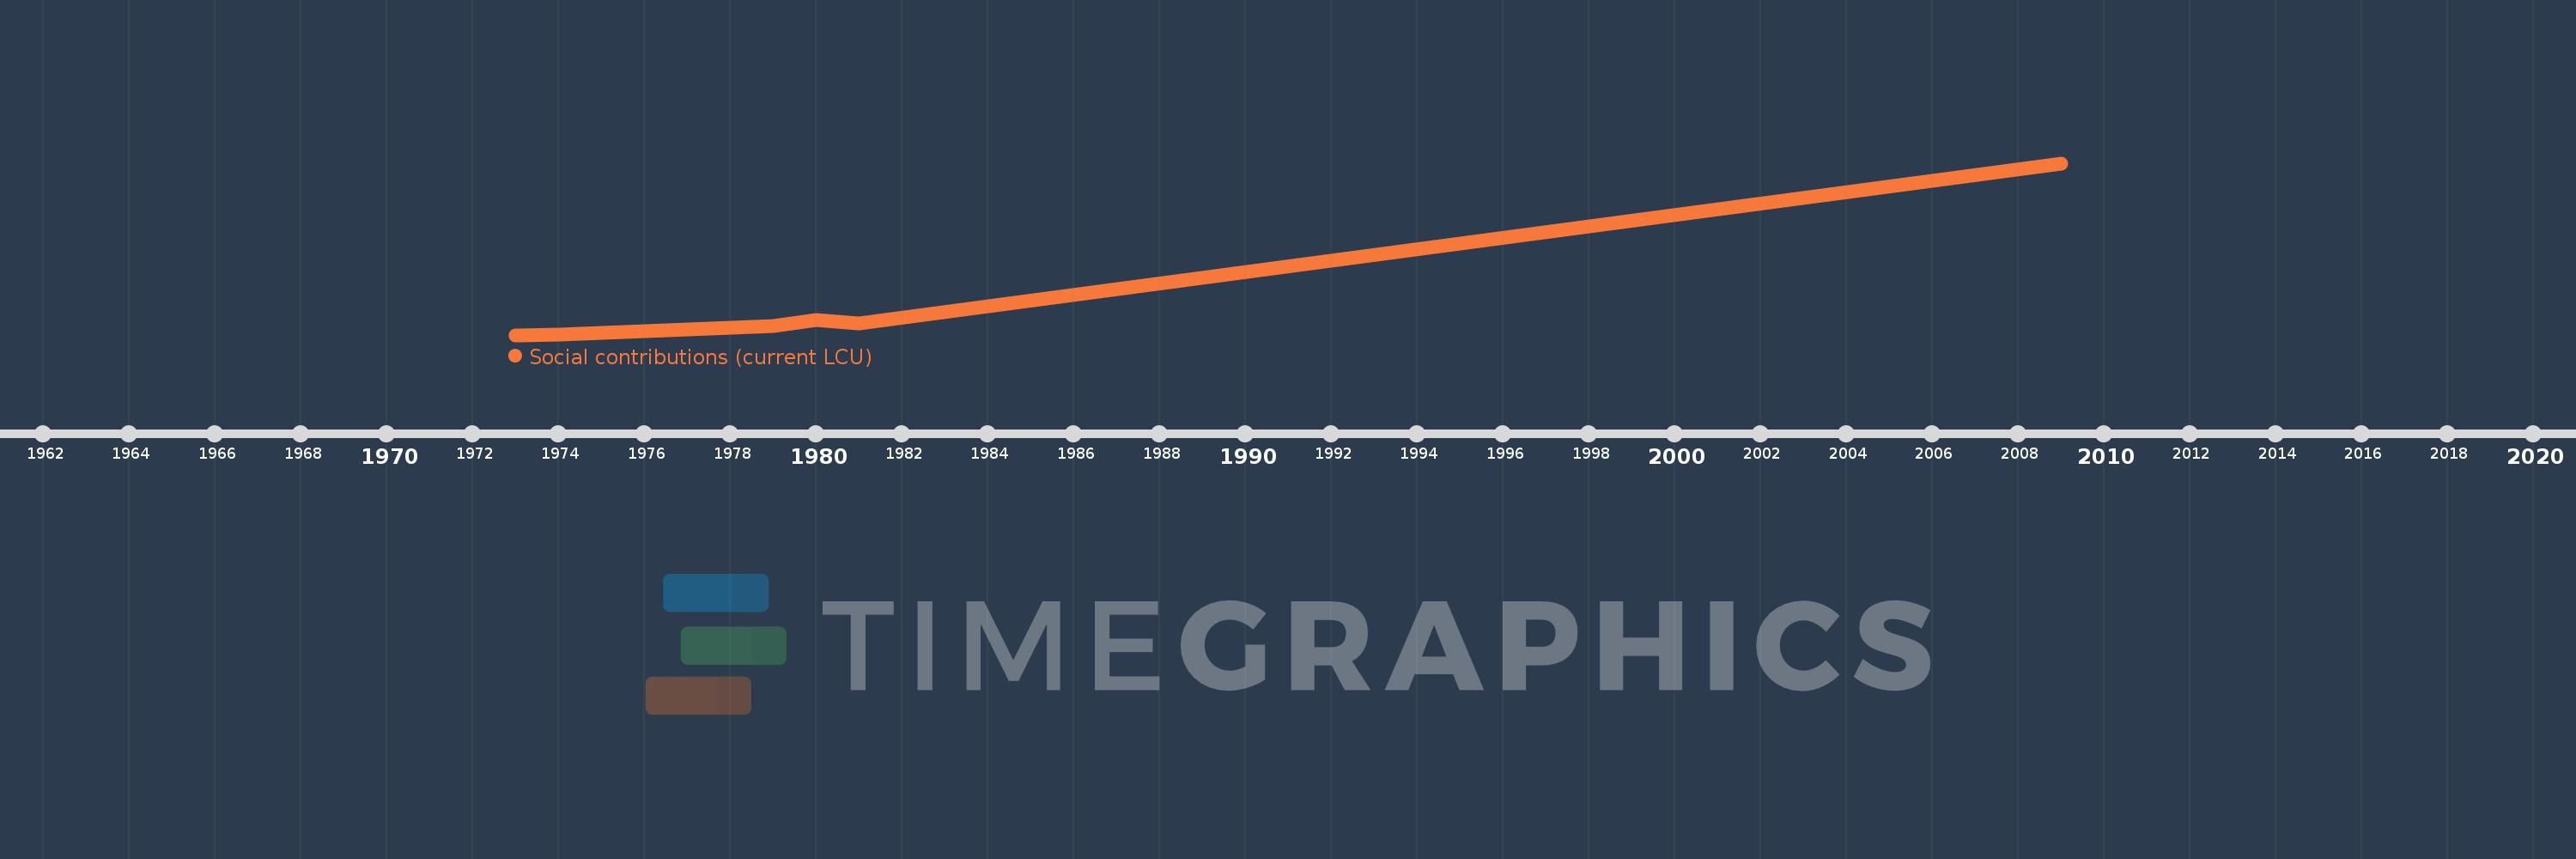
This timeline shows a graph from 1973 to 2009 of Madagascar. No data until 1972. Number of actual observations by date: 6.
Source name:
World Development Indicators
Source organization:
International Monetary Fund, Government Finance Statistics Yearbook and data files.
Categories, topics:
Public Sector
Last updated:
apr 23, 2017
Indicators value changes by year
Minimum:
3.499 bln
jan 1, 1973
Maximum:
137.1 bln
jan 1, 2009
At the date of observation
Value
Absolute change
Change from the previous value
jan 1, 1973
3.499 bln
+3.499 bln
0.0%
jan 1, 1974
3.659 bln
+160.0 mln
4.57%
jan 1, 1979
10.275 bln
+6.616 bln
180.81%
jan 1, 1980
15.126 bln
+4.851 bln
47.21%
jan 1, 1981
12.818 bln
-2.308 bln
-15.26%
jan 1, 2009
137.1 bln
+124.282 bln
969.59%
Ranking of countries by current statistics by years