Download This statistics in other country:
Timeline:
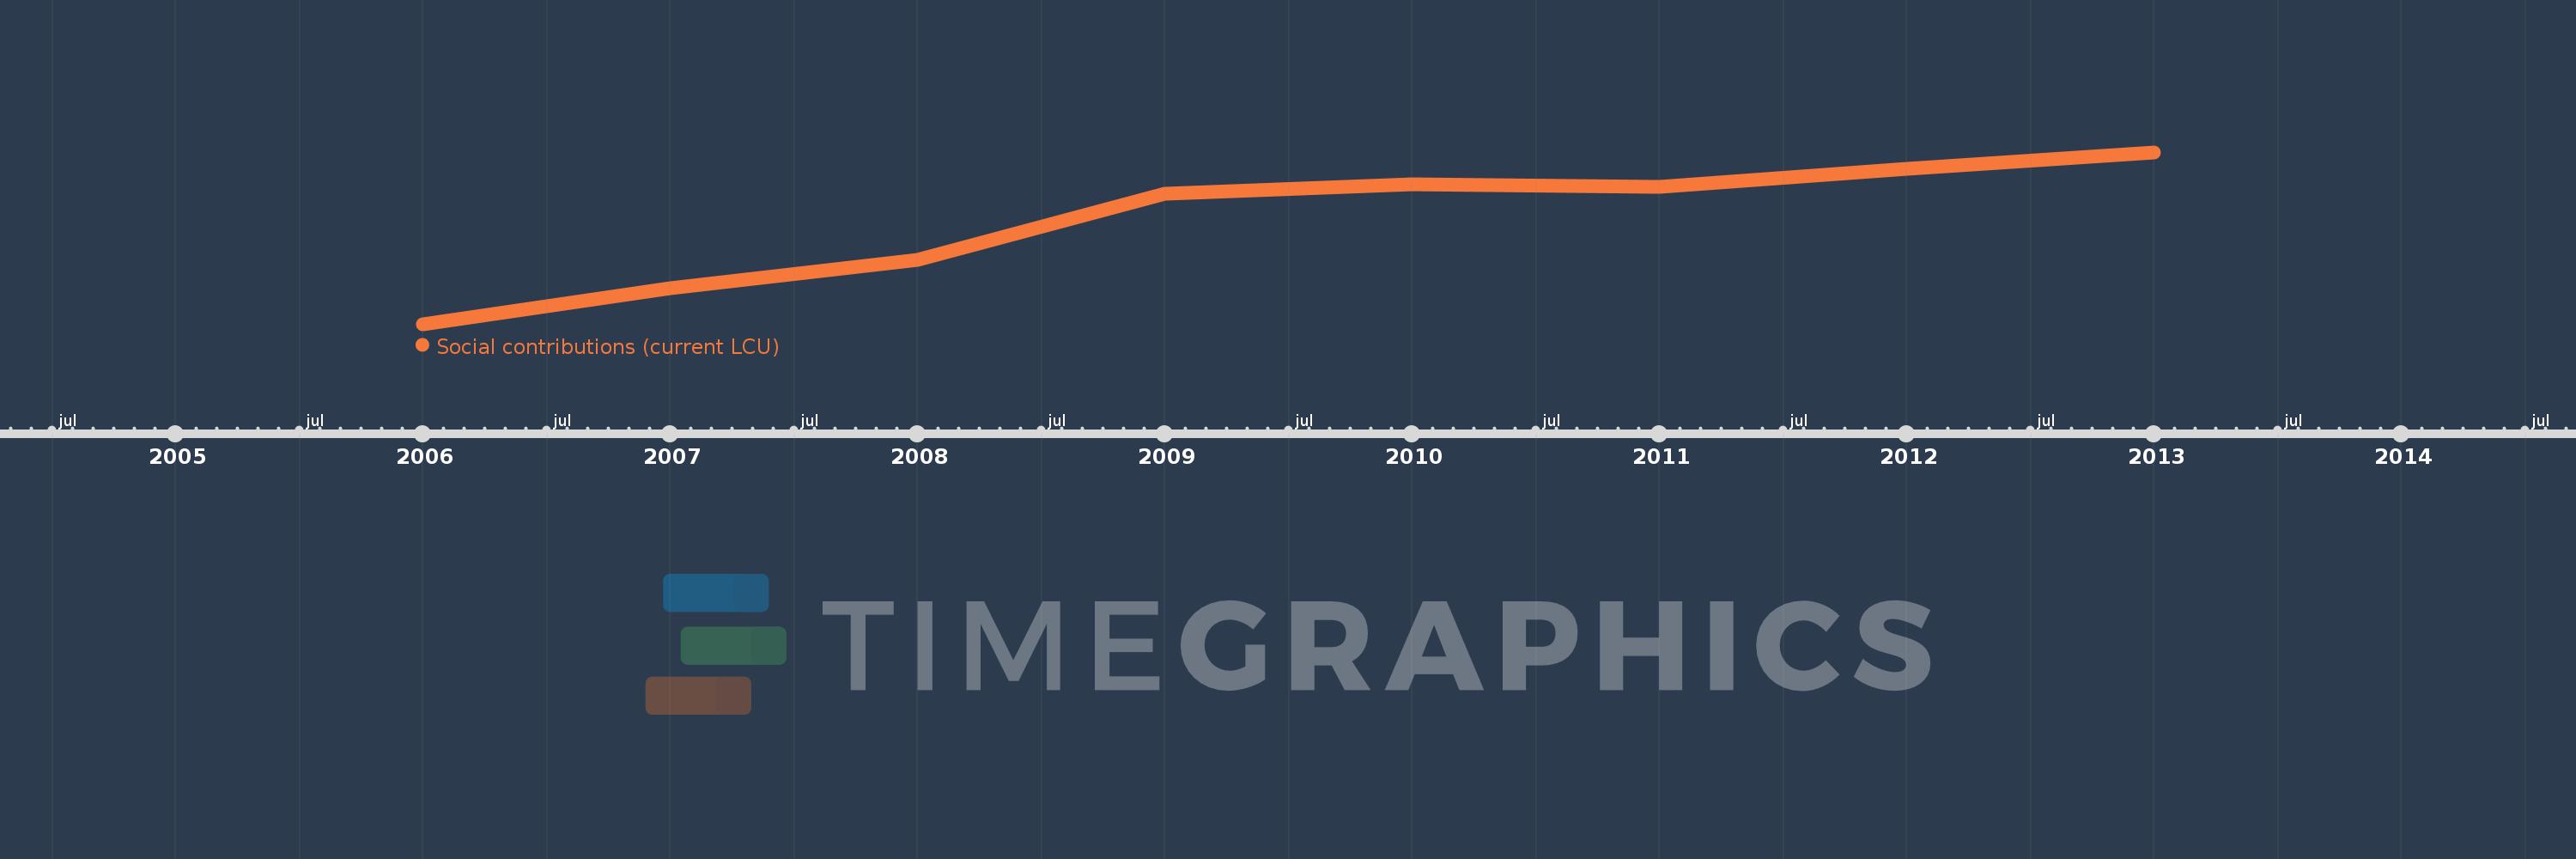
This timeline shows a graph from 2006 to 2013 of Macedonia, FYR. No data until 2005. Number of actual observations by date: 8.
Source name:
World Development Indicators
Source organization:
International Monetary Fund, Government Finance Statistics Yearbook and data files.
Categories, topics:
Public Sector
Last updated:
apr 23, 2017
Indicators value changes by year
Minimum:
30.31 bln
jan 1, 2006
Maximum:
40.765 bln
jan 1, 2013
At the date of observation
Value
Absolute change
Change from the previous value
jan 1, 2006
30.31 bln
+30.31 bln
0.0%
jan 1, 2007
32.511 bln
+2.201 bln
7.26%
jan 1, 2008
34.206 bln
+1.695 bln
5.21%
jan 1, 2009
38.249 bln
+4.043 bln
11.82%
jan 1, 2010
38.837 bln
+588.0 mln
1.54%
jan 1, 2011
38.687 bln
-150.0 mln
-0.39%
jan 1, 2012
39.759 bln
+1.072 bln
2.77%
jan 1, 2013
40.765 bln
+1.006 bln
2.53%
Ranking of countries by current statistics by years