Download This statistics in other country:
Timeline:
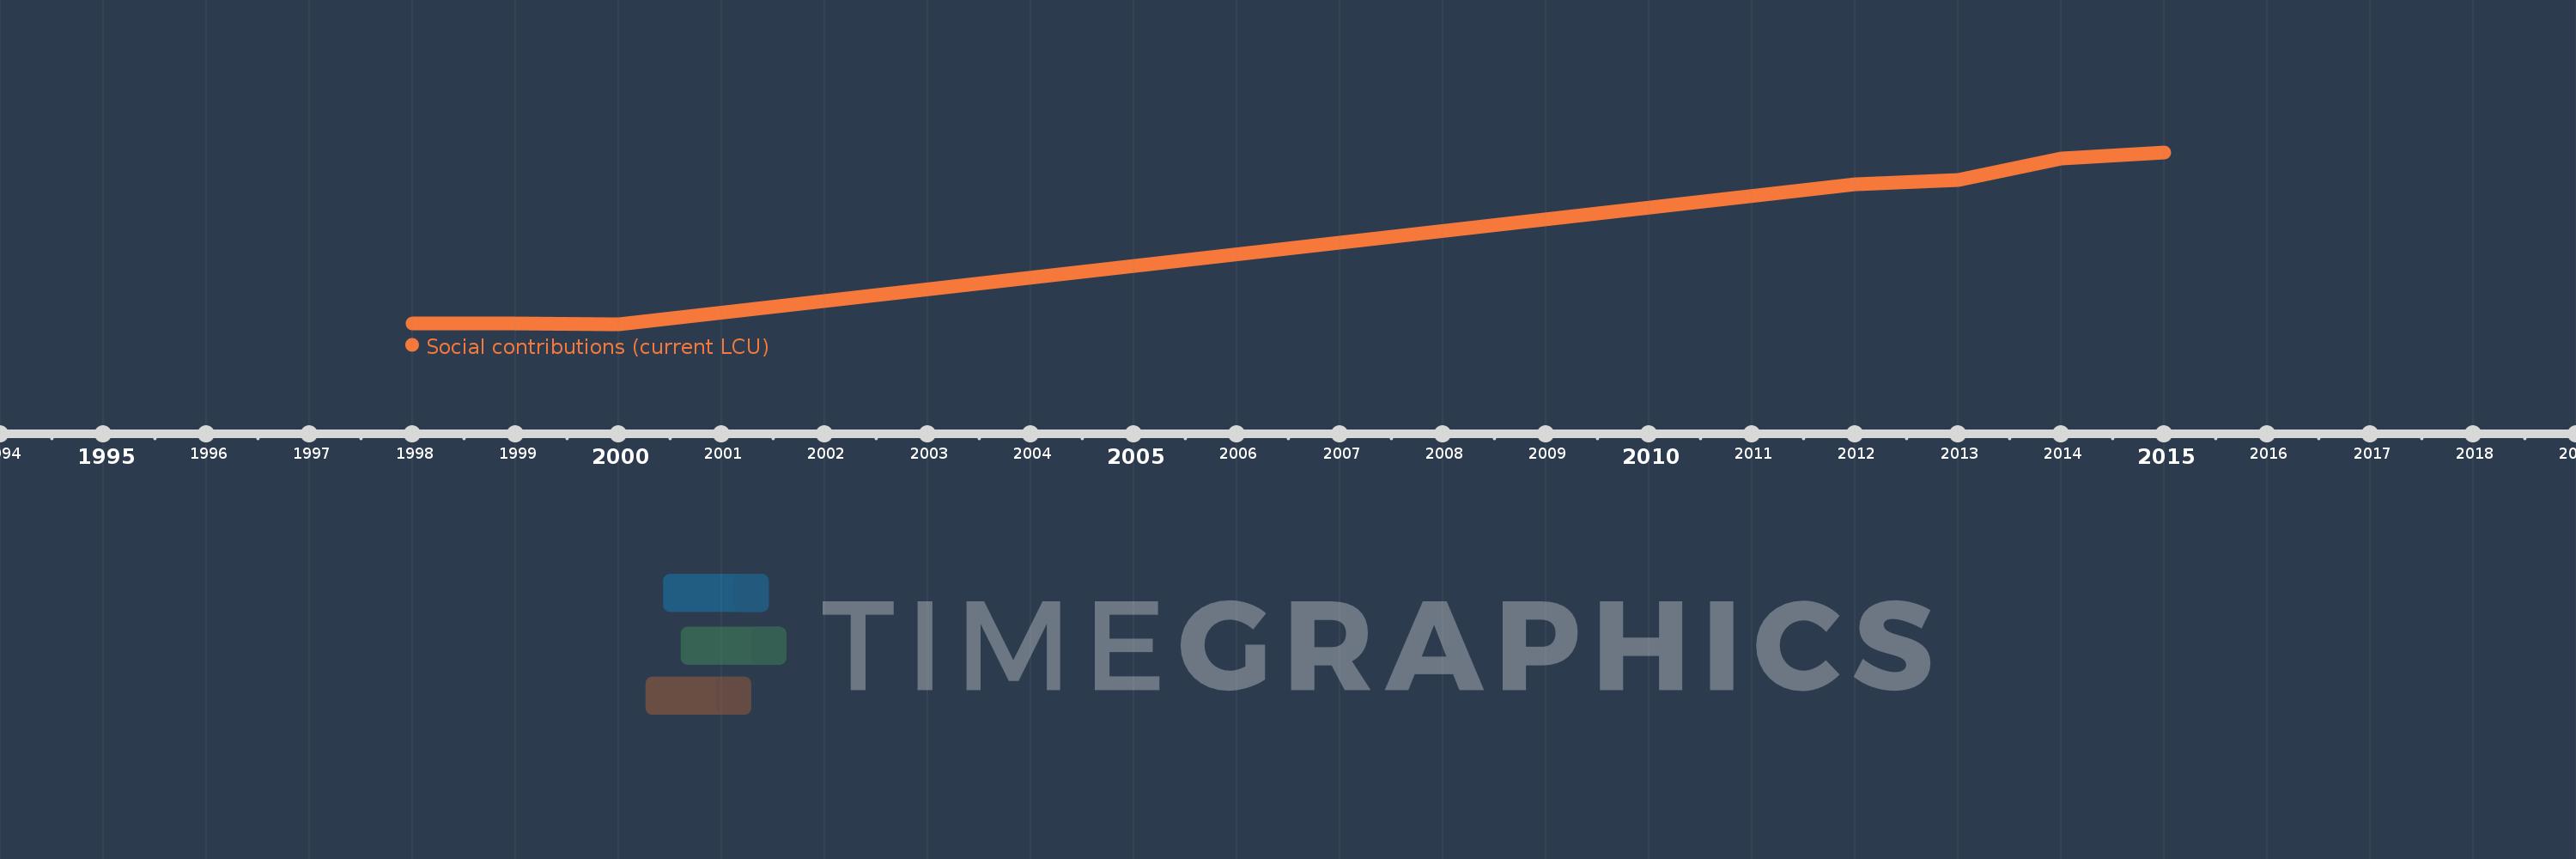
This timeline shows a graph from 1998 to 2015 of United Arab Emirates. No data until 1997. Number of actual observations by date: 7.
Source name:
World Development Indicators
Source organization:
International Monetary Fund, Government Finance Statistics Yearbook and data files.
Categories, topics:
Public Sector
Last updated:
apr 23, 2017
Indicators value changes by year
Minimum:
92.0 mln
jan 1, 2000
Maximum:
5.271 bln
jan 1, 2015
At the date of observation
Value
Absolute change
Change from the previous value
jan 1, 1998
103.0 mln
+103.0 mln
0.0%
jan 1, 1999
122.0 mln
+19.0 mln
18.45%
jan 1, 2000
92.0 mln
-30.0 mln
-24.59%
jan 1, 2012
4.303 bln
+4.211 bln
4.58K%
jan 1, 2013
4.445 bln
+141.026 mln
3.28%
jan 1, 2014
5.079 bln
+634.571 mln
14.28%
jan 1, 2015
5.271 bln
+192.314 mln
3.79%
Ranking of countries by current statistics by years