Download This statistics in other country:
Timeline:
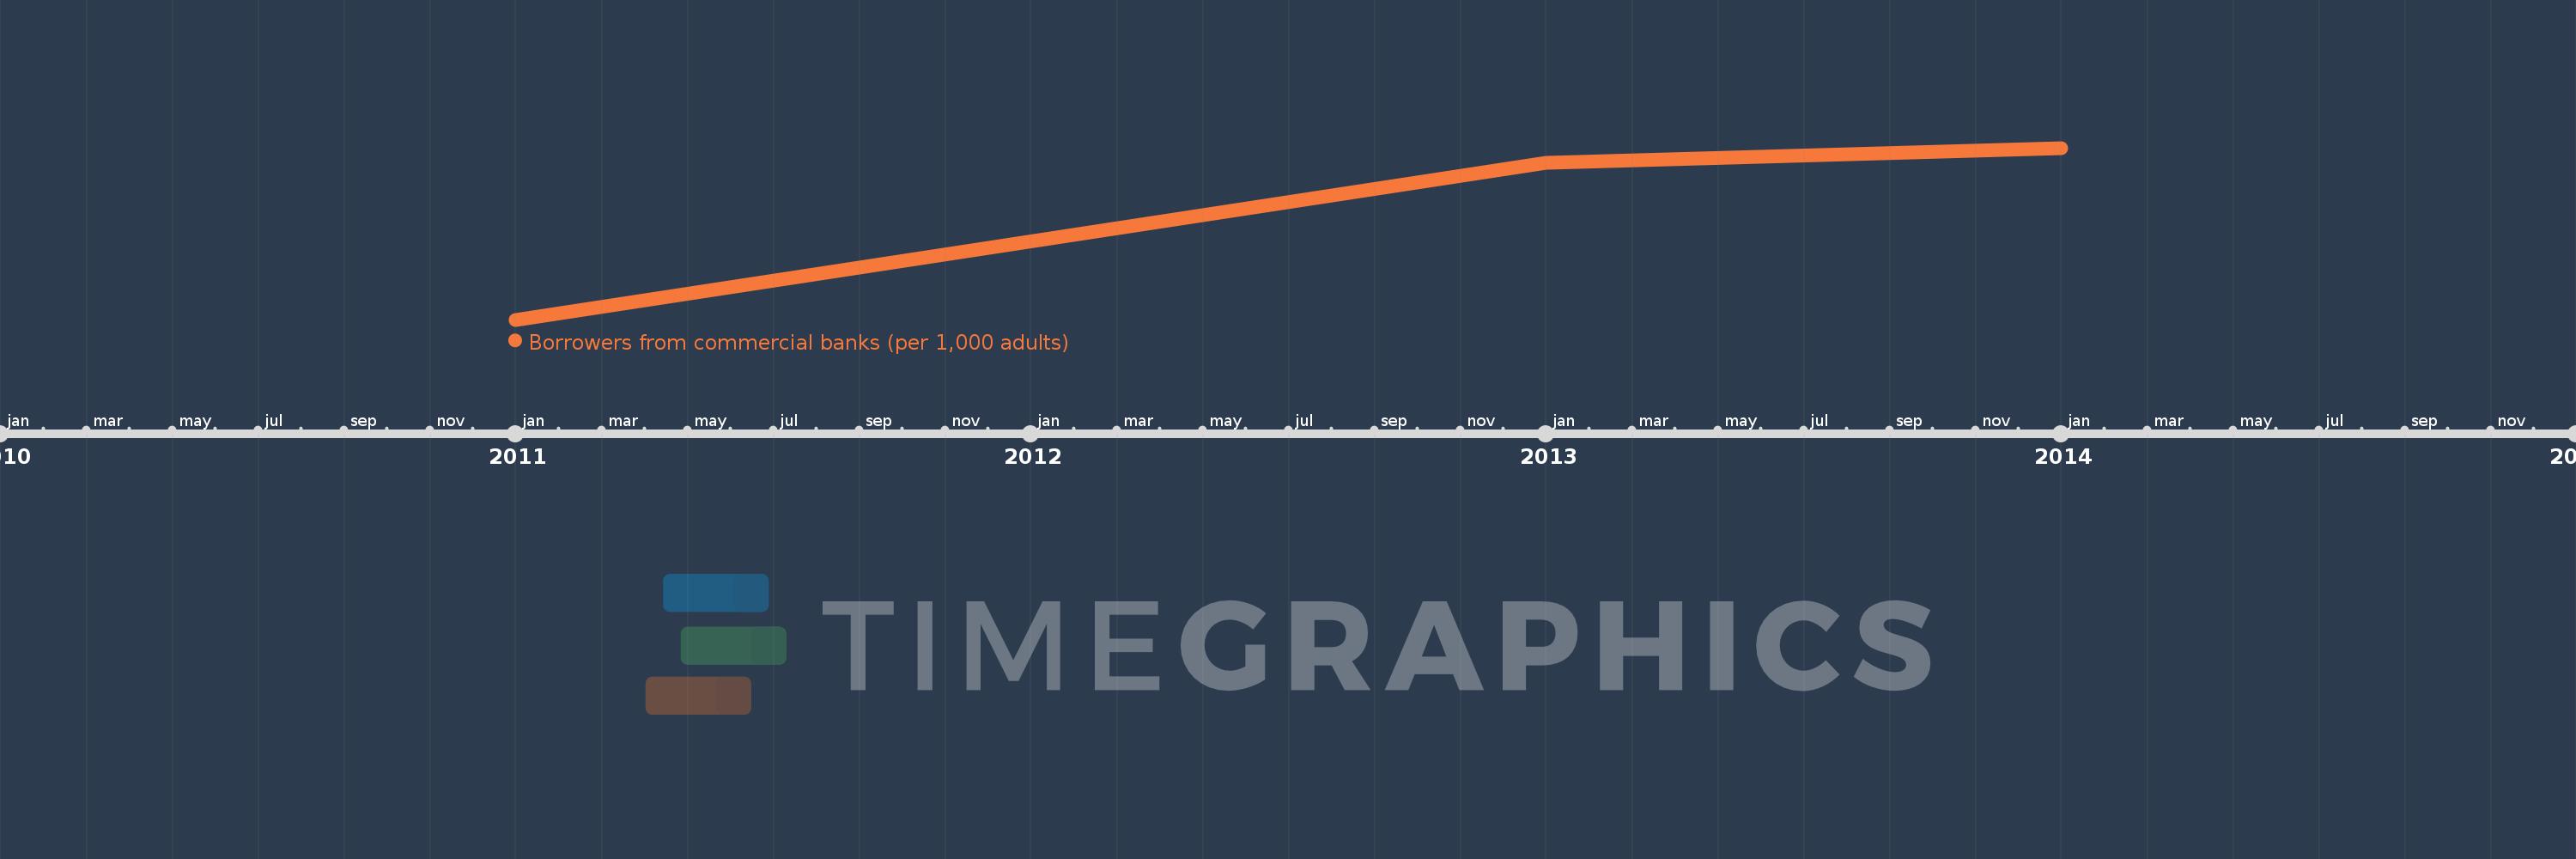
This timeline shows a graph from 2011 to 2014 of World. No data until 2010. Number of actual observations by date: 3.
Source name:
World Development Indicators
Source organization:
International Monetary Fund, Financial Access Survey.
Categories, topics:
Financial Sector
Last updated:
apr 23, 2017
Indicators value changes by year
Minimum:
85.592
jan 1, 2011
Maximum:
136.838
jan 1, 2014
At the date of observation
Value
Absolute change
Change from the previous value
jan 1, 2011
85.592
+85.592
0.0%
jan 1, 2013
132.293
+46.701
54.56%
jan 1, 2014
136.838
+4.545
3.44%
Ranking of countries by current statistics by years