Download This statistics in other country:
Timeline:
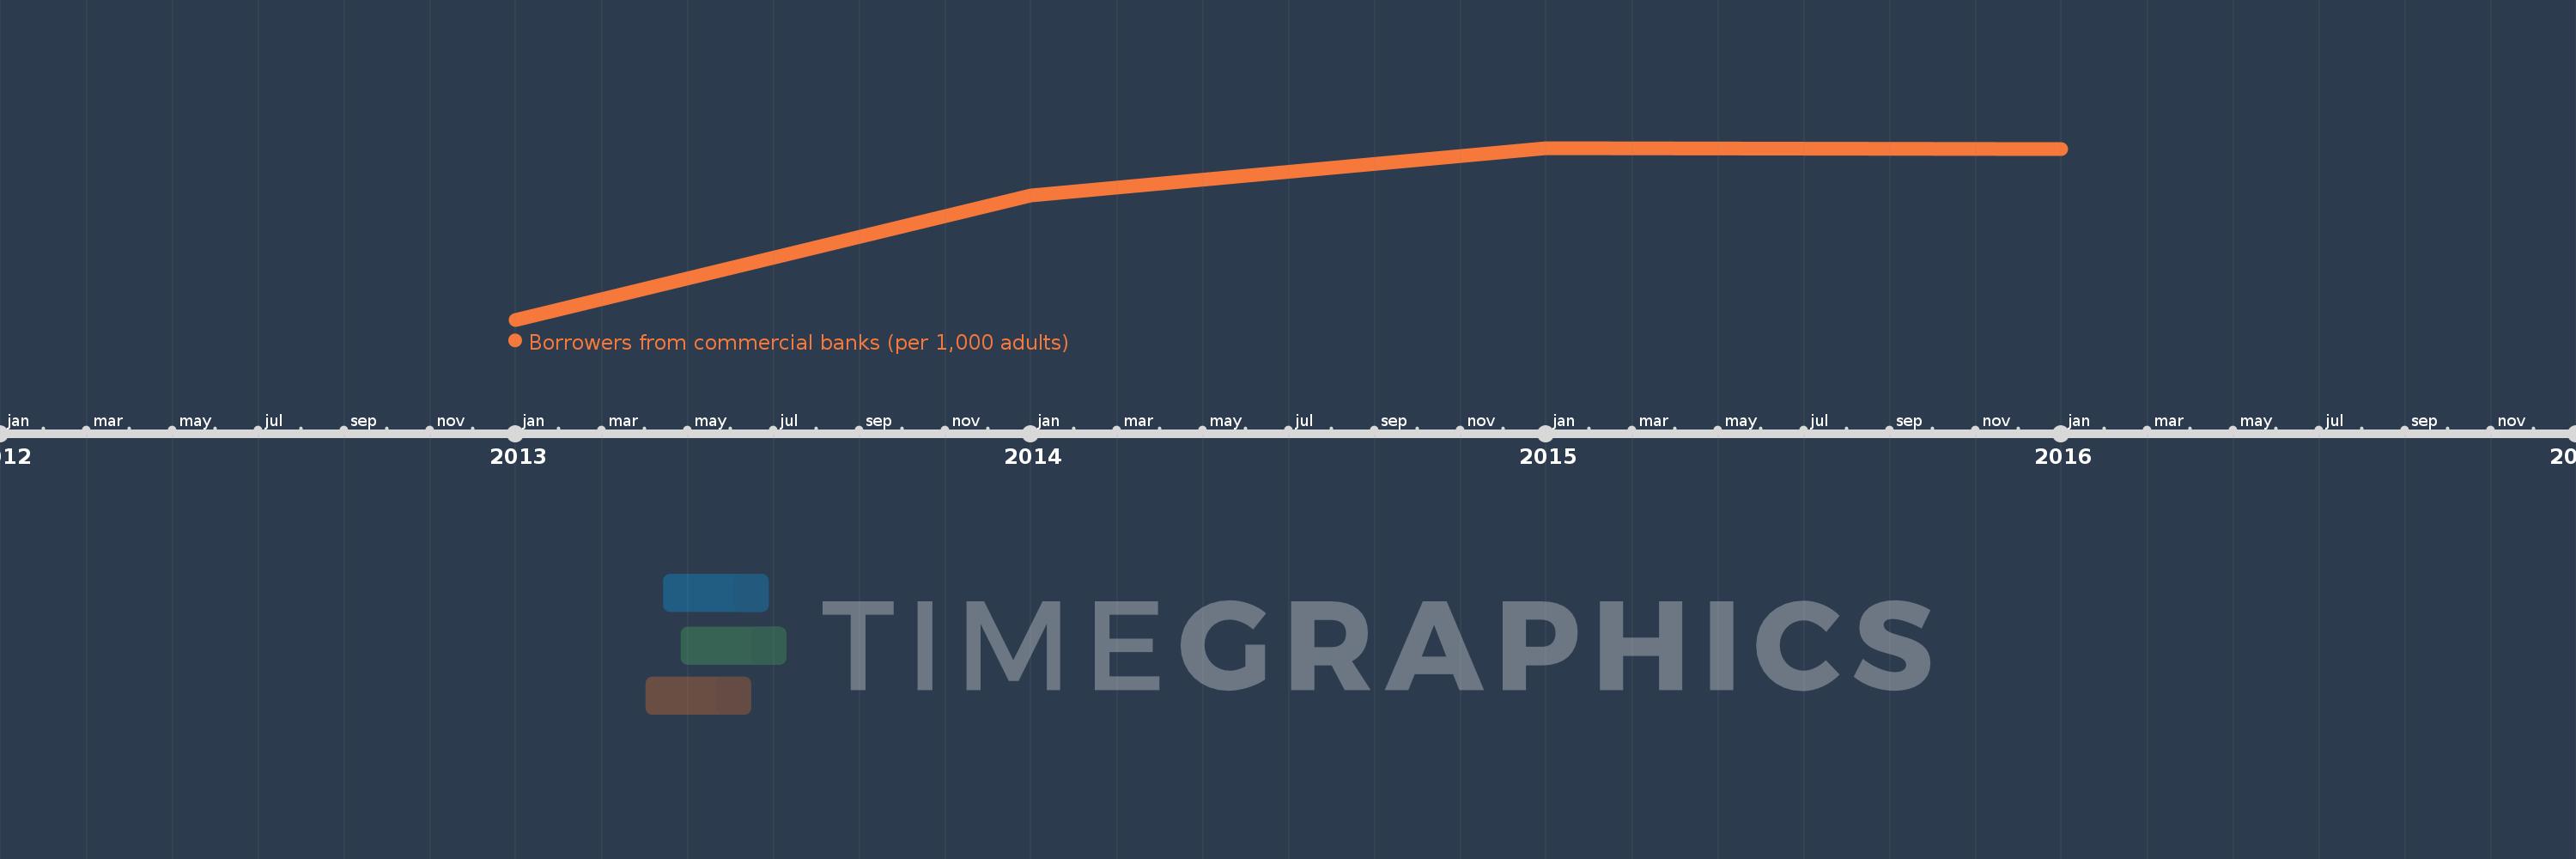
This timeline shows a graph from 2013 to 2016 of Palau. No data until 2012. Number of actual observations by date: 4.
Source name:
World Development Indicators
Source organization:
International Monetary Fund, Financial Access Survey.
Categories, topics:
Financial Sector
Last updated:
apr 23, 2017
Indicators value changes by year
Minimum:
299.079
jan 1, 2013
Maximum:
369.737
jan 1, 2015
At the date of observation
Value
Absolute change
Change from the previous value
jan 1, 2013
299.079
+299.079
0.0%
jan 1, 2014
350.163
+51.084
17.08%
jan 1, 2015
369.737
+19.575
5.59%
jan 1, 2016
369.431
-0.306
-0.08%
Ranking of countries by current statistics by years