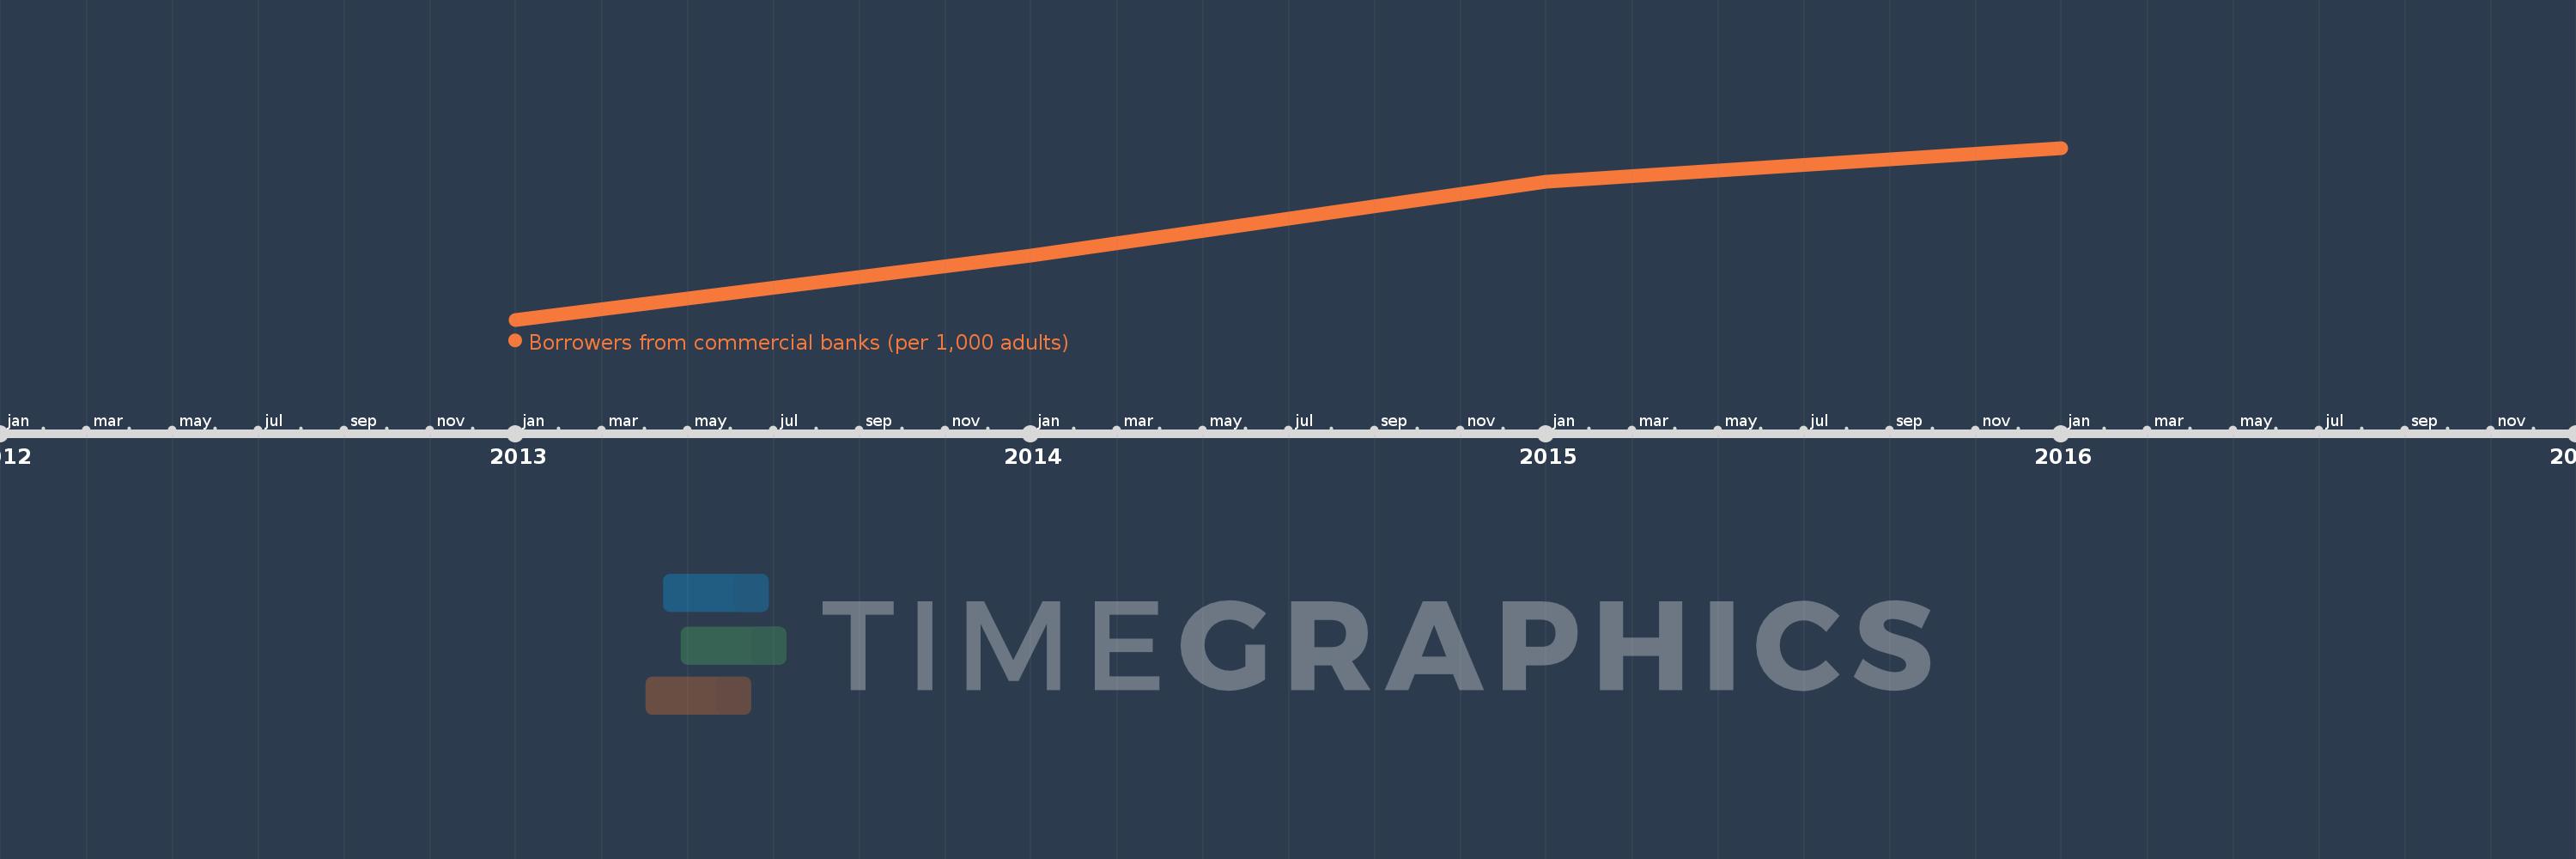
This timeline shows a graph from 2013 to 2016 of East Asia & Pacific (IDA & IBRD countries). No data until 2012. Number of actual observations by date: 4.
Source name:
World Development Indicators
Source organization:
International Monetary Fund, Financial Access Survey.
Categories, topics:
Financial Sector
Last updated:
apr 23, 2017
Indicators value changes by year
Meaning:
297.716
Minimum:
271.846
jan 1, 2013
Maximum:
319.396
jan 1, 2016
At the date of observation
Value
Absolute change
Change from the previous value
jan 1, 2013
271.846
+271.846
0.0%
jan 1, 2014
289.488
+17.641
6.49%
jan 1, 2015
310.132
+20.644
7.13%
jan 1, 2016
319.396
+9.264
2.99%
Ranking of countries by current statistics by years