Download This statistics in other country:
Timeline:
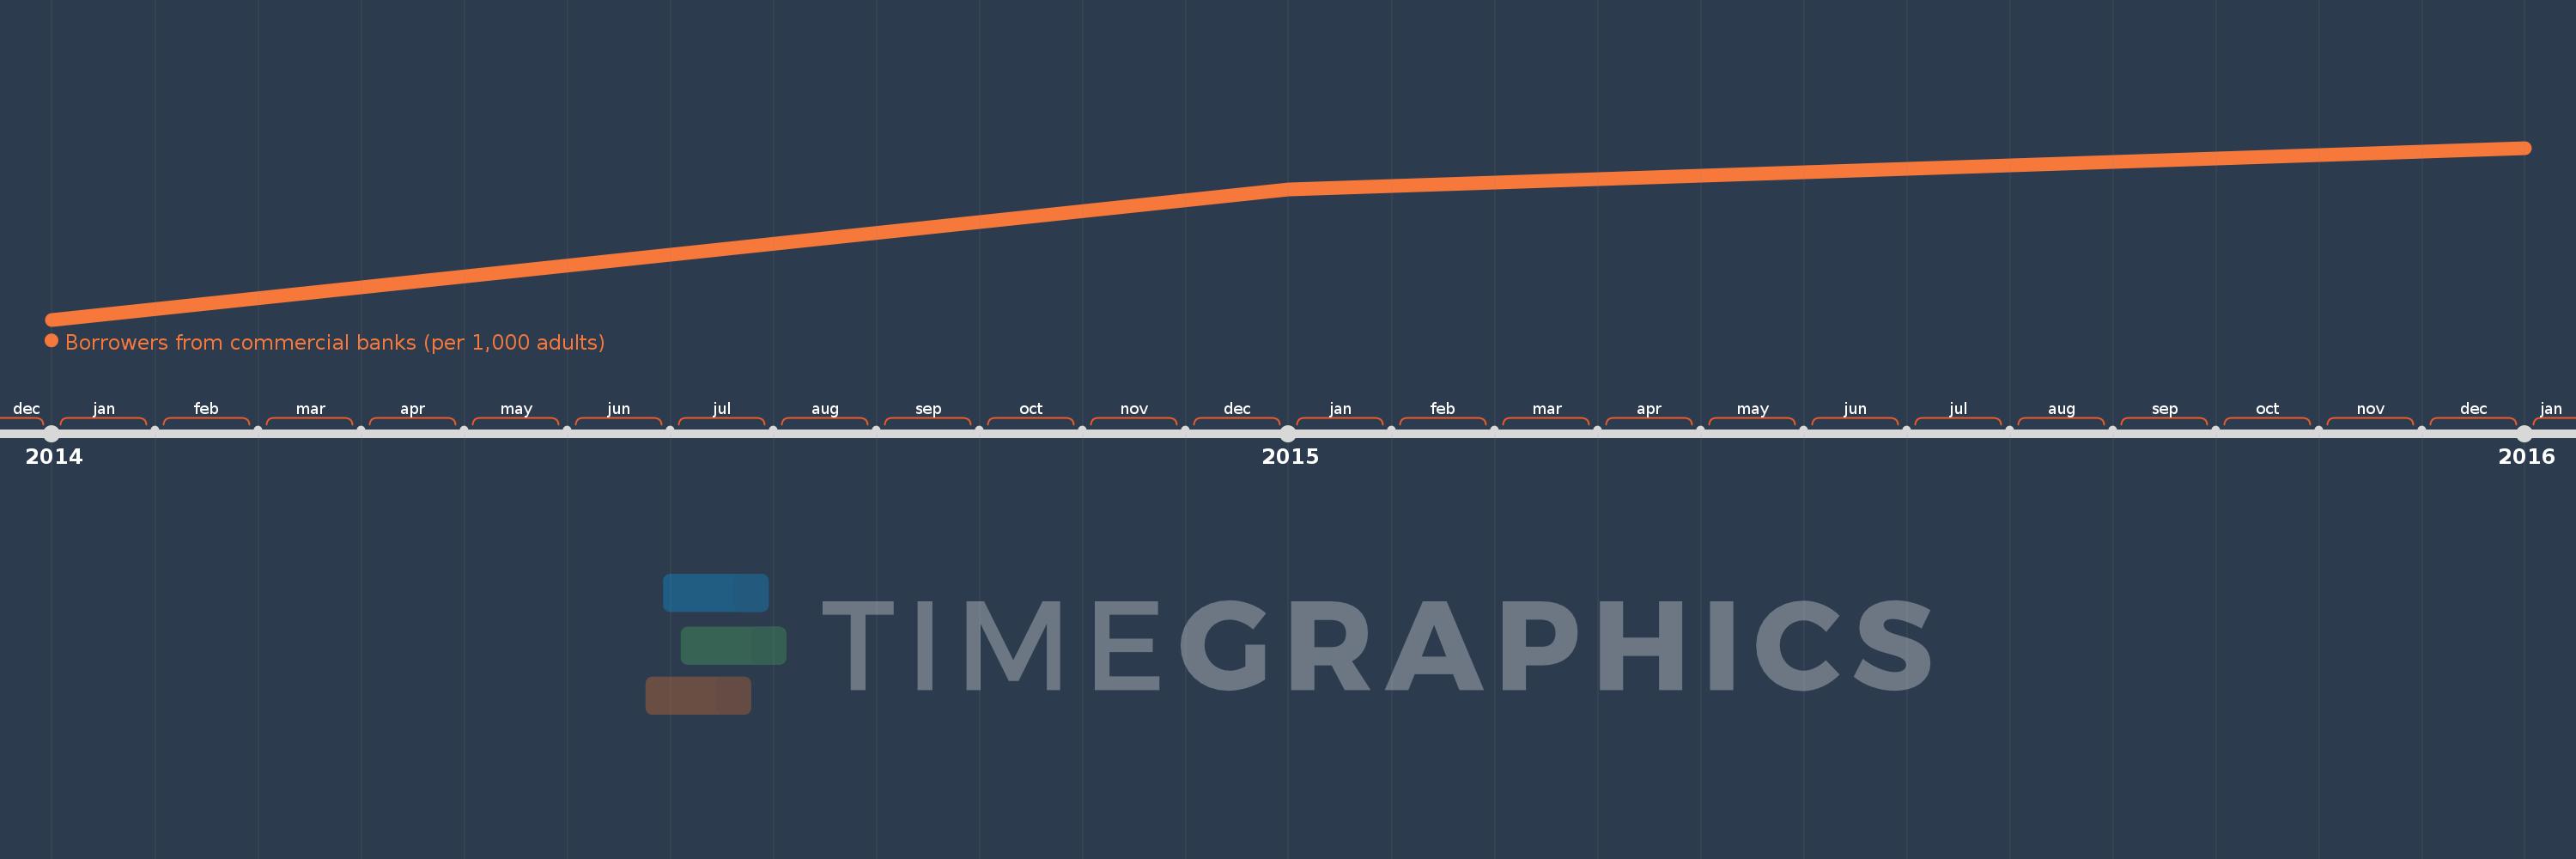
This timeline shows a graph from 2014 to 2016 of Congo, Rep.. No data until 2013. Number of actual observations by date: 3.
Source name:
World Development Indicators
Source organization:
International Monetary Fund, Financial Access Survey.
Categories, topics:
Financial Sector
Last updated:
apr 23, 2017
Indicators value changes by year
Minimum:
21.146
jan 1, 2014
Maximum:
41.358
jan 1, 2016
At the date of observation
Value
Absolute change
Change from the previous value
jan 1, 2014
21.146
+21.146
0.0%
jan 1, 2015
36.433
+15.288
72.3%
jan 1, 2016
41.358
+4.925
13.52%
Ranking of countries by current statistics by years